")
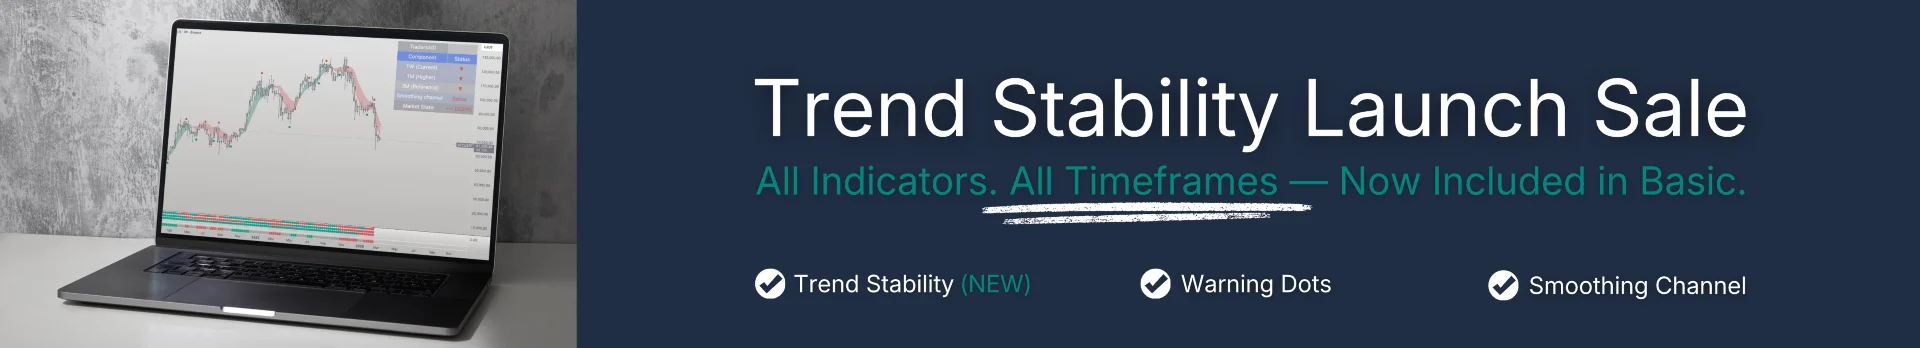
Finally, an indicator that confirms the trend clearly — so you can trade with more confidence.
Most traders struggle to identify the trend direction of assets. Traders AID decodes price data, momentum, and volatility to provide clear insights on potential trend changes.
This helps you to make confident decisions and stay ahead of the market.
Watch our 60 second video to learn more, or get your free trial below.
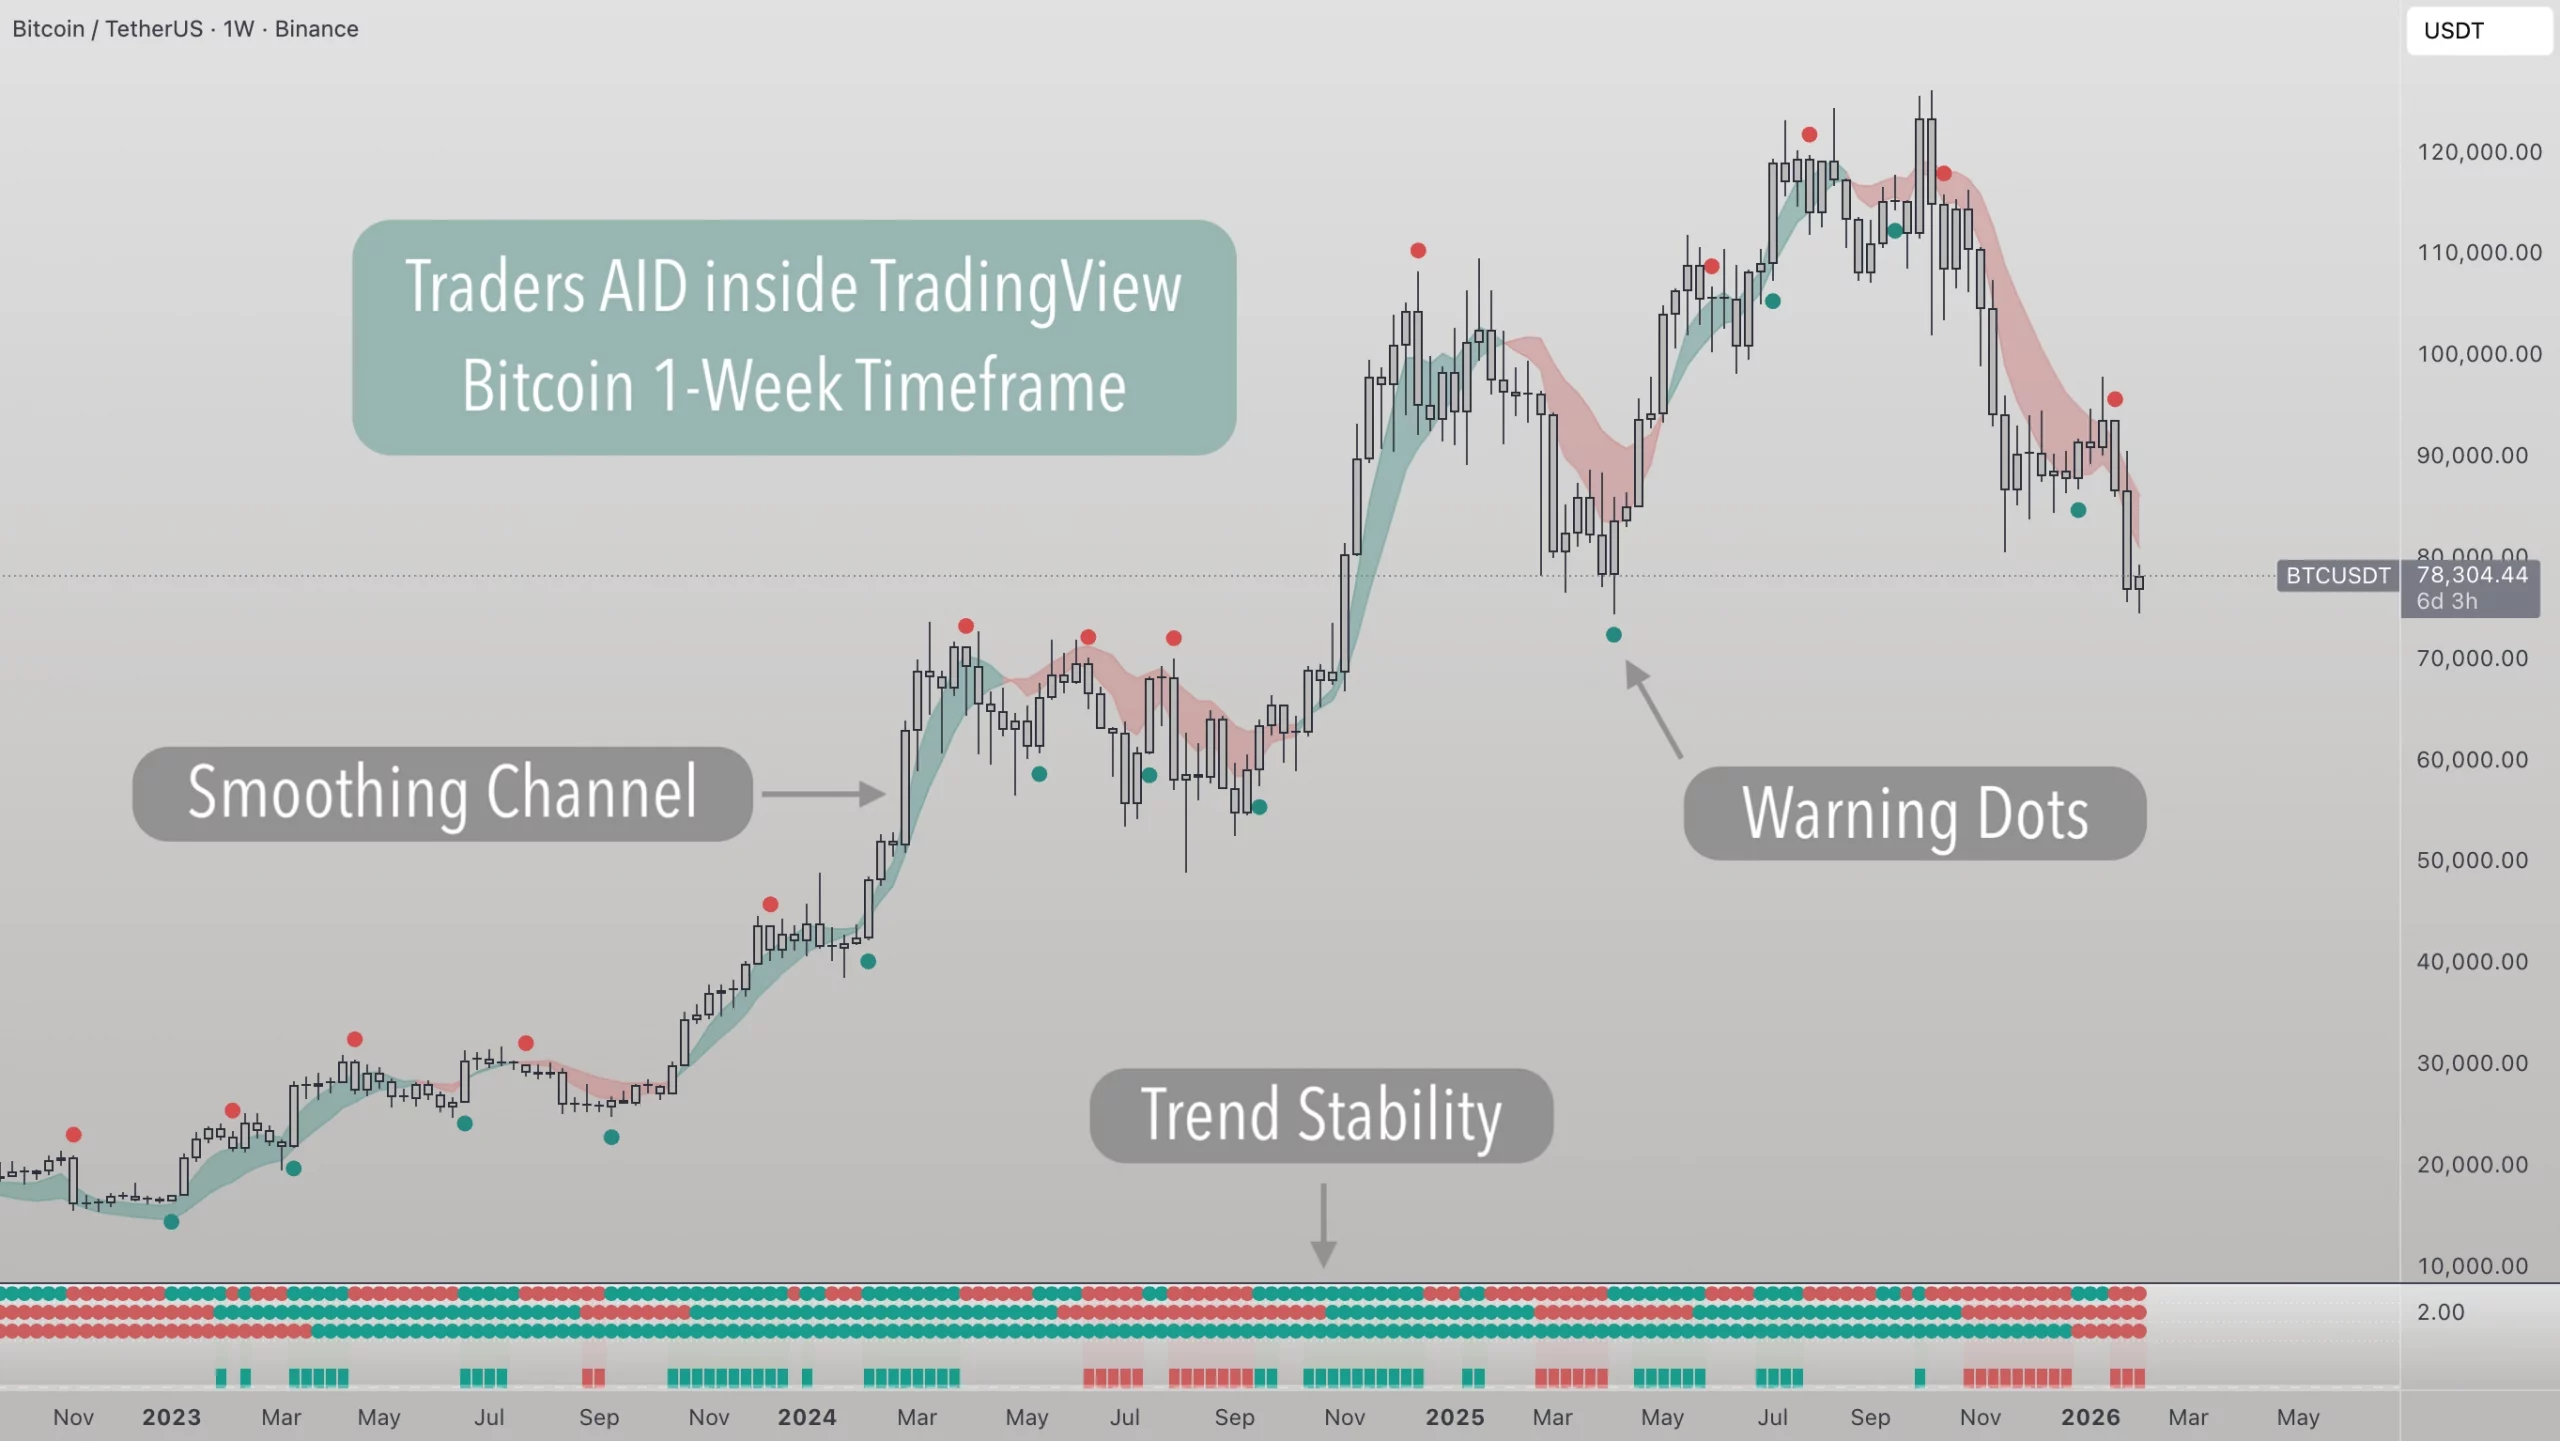
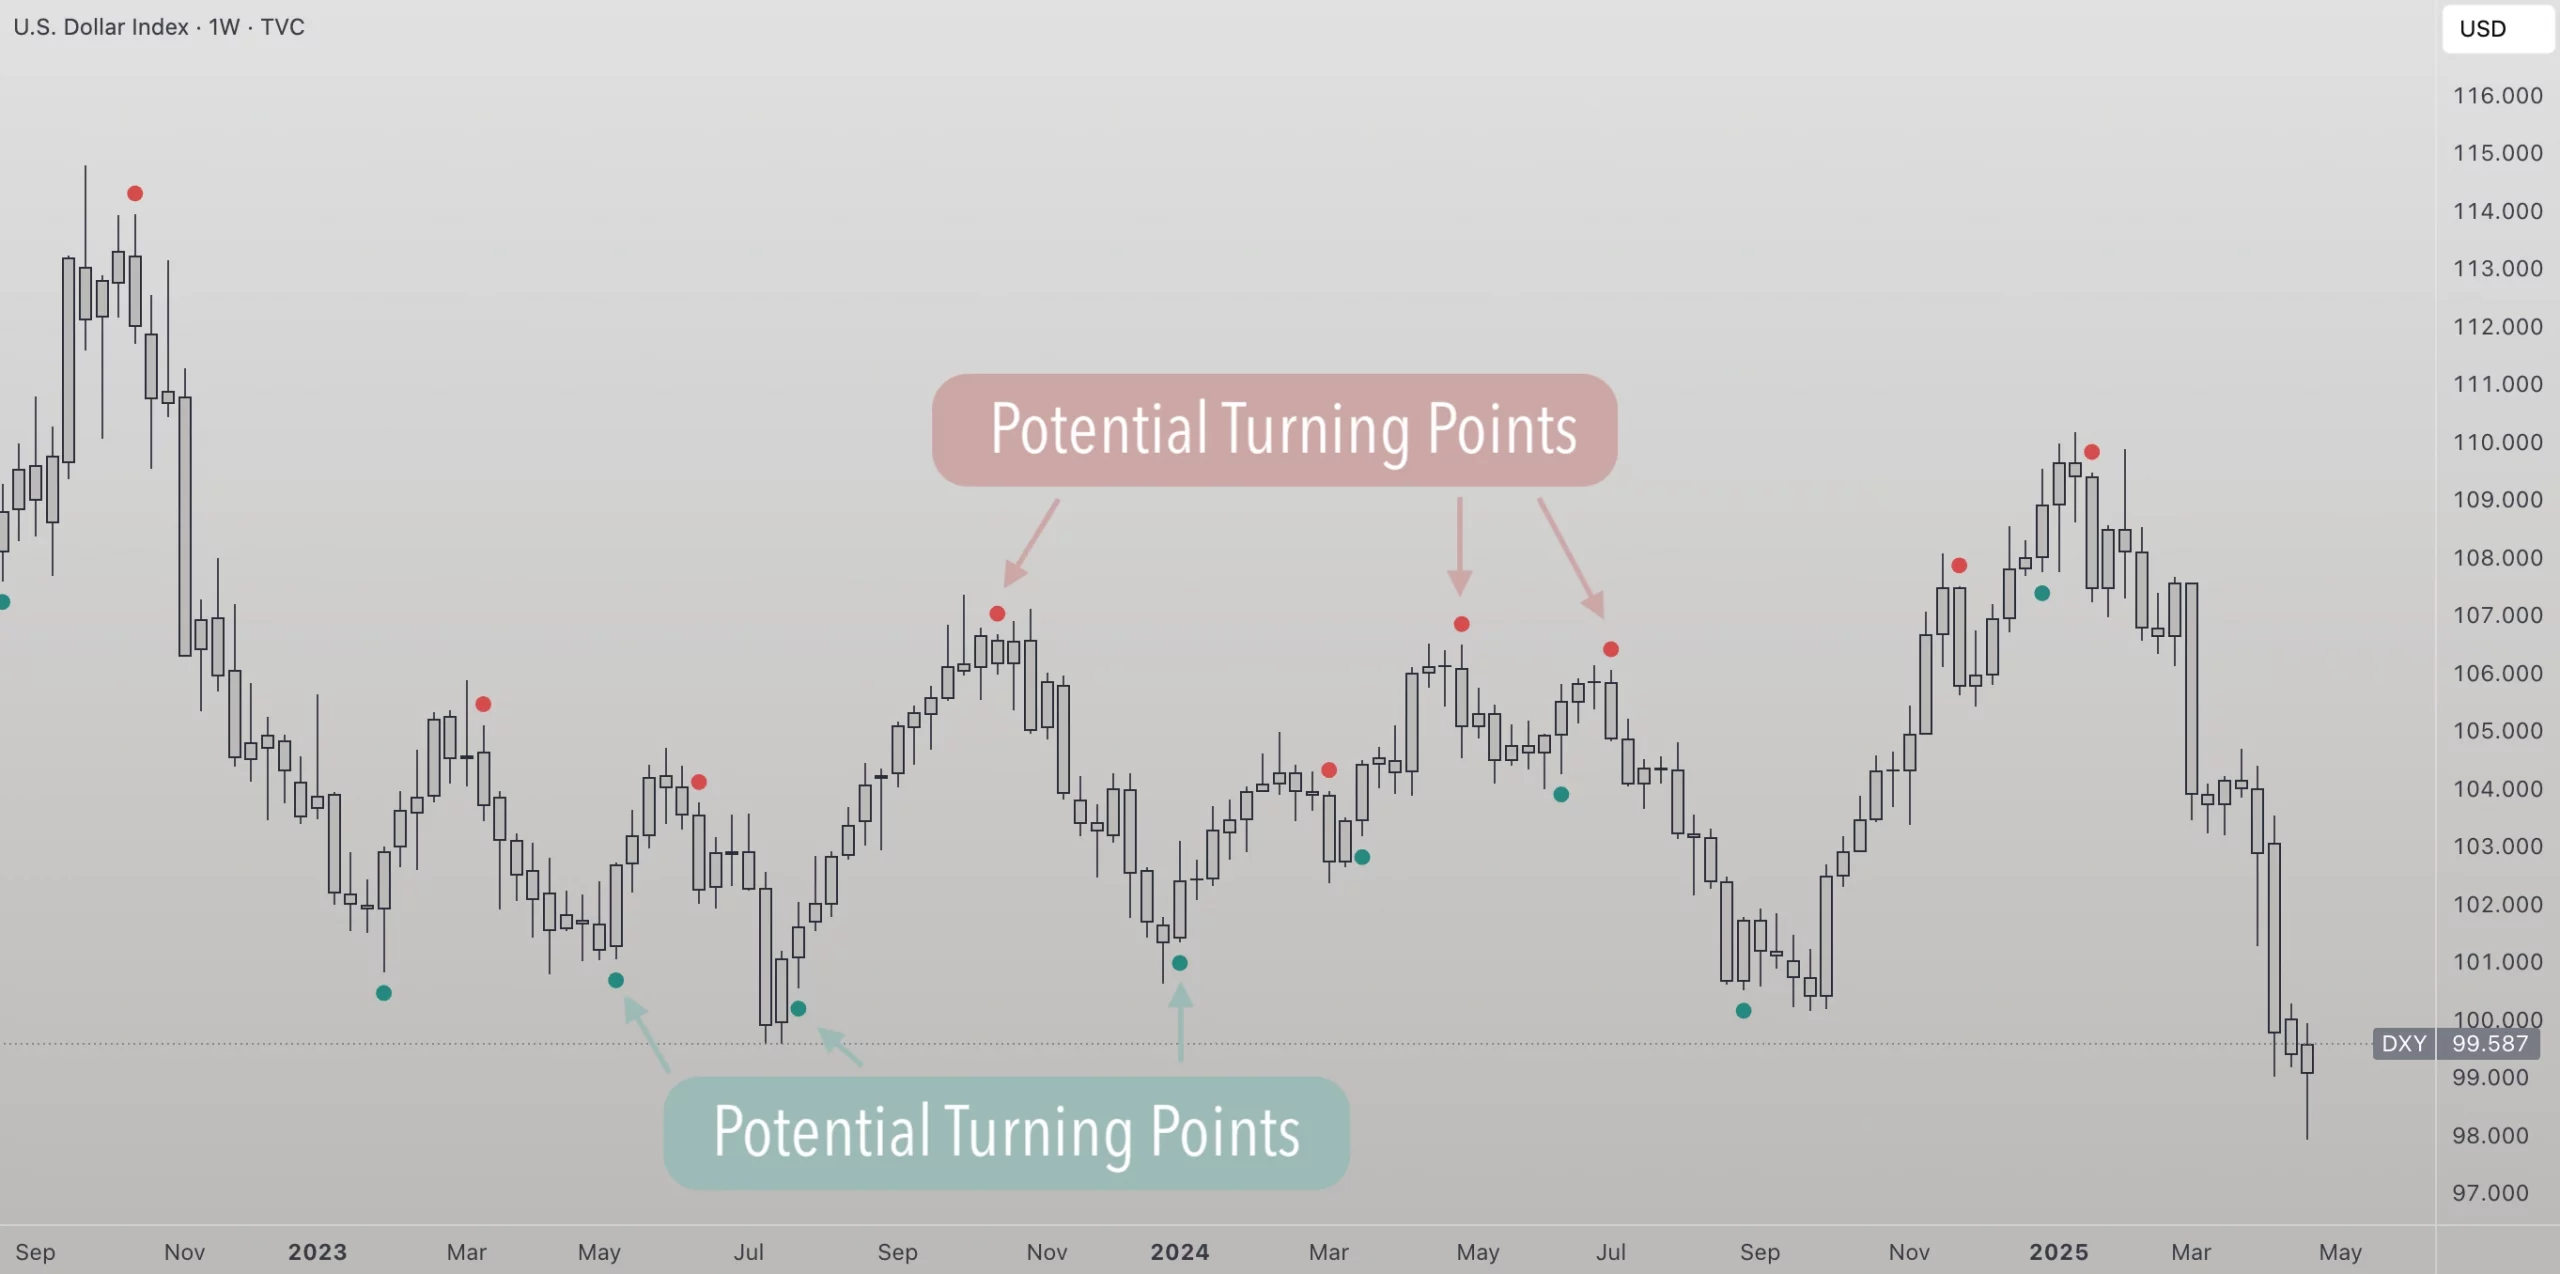
Traders AID helps traders and investors see trend direction, possible turning points, and trend stability — across any market and timeframe.
Traders AID runs directly inside:
You don’t need a new platform or workflow. Traders AID fits into the tools you already use every day.
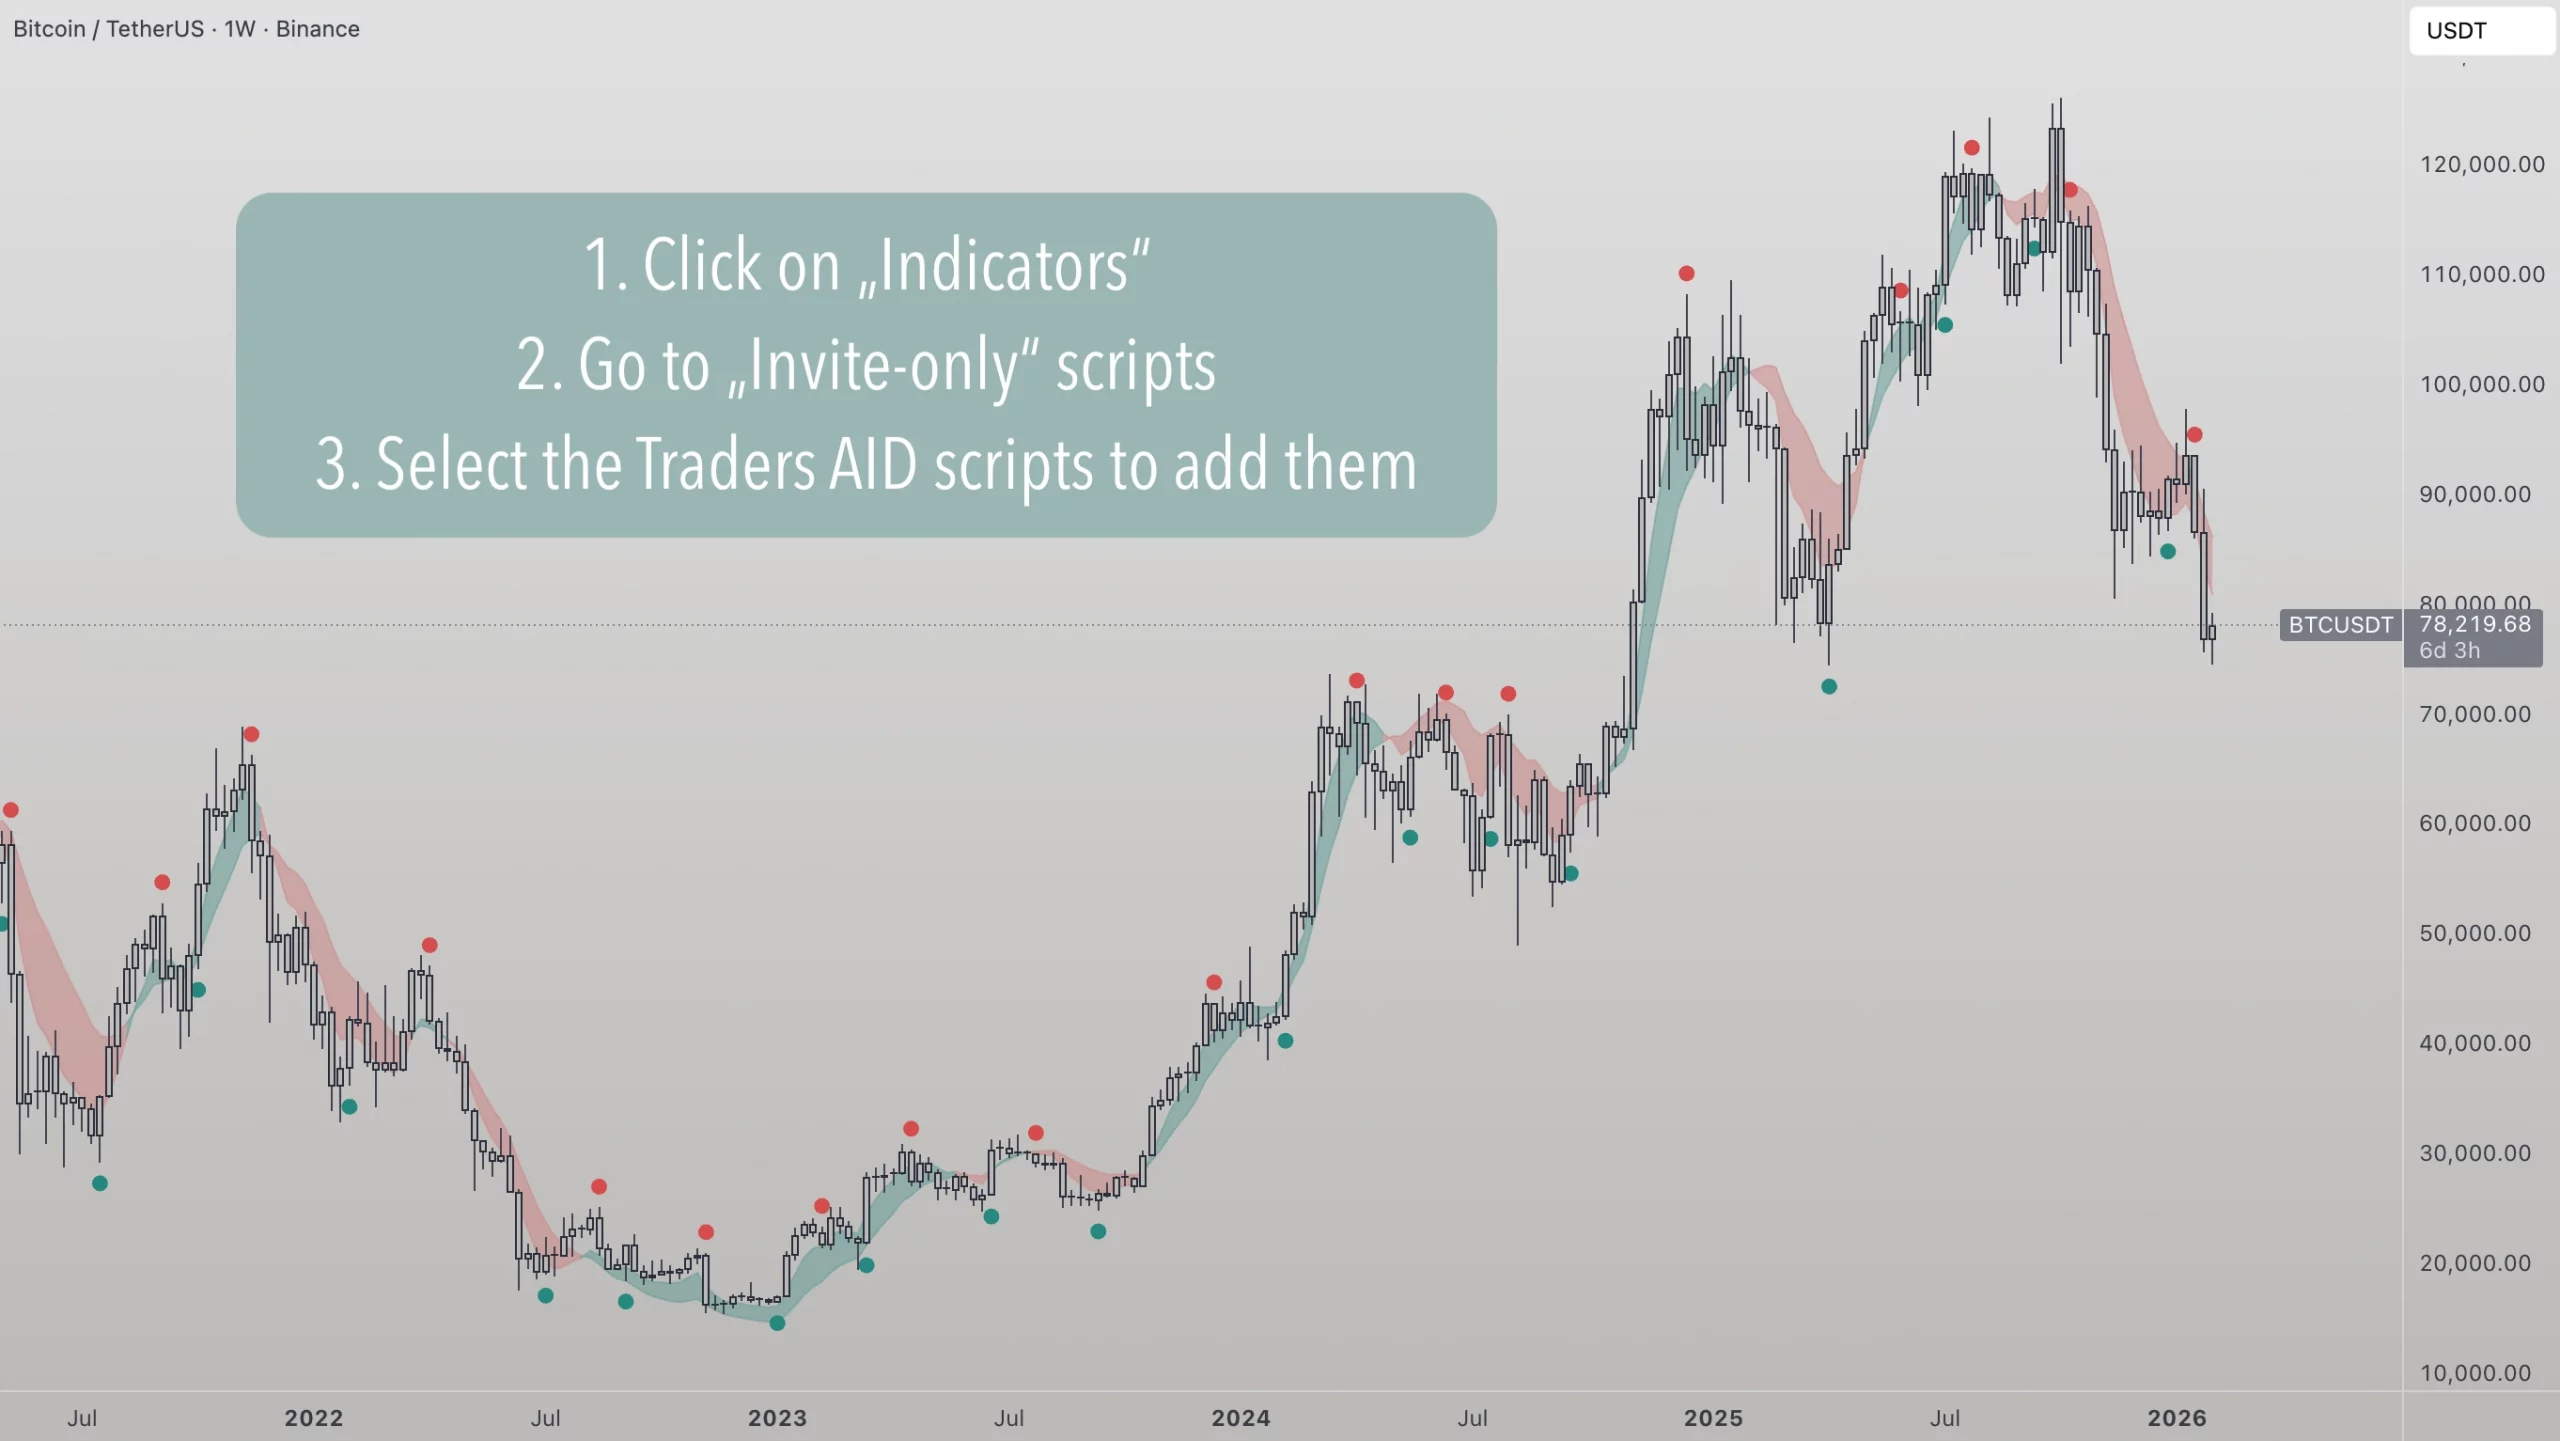
To add Traders AID in TradingView:
Once access is granted, all available Traders AID indicators appear there and can be added like regular indicators.
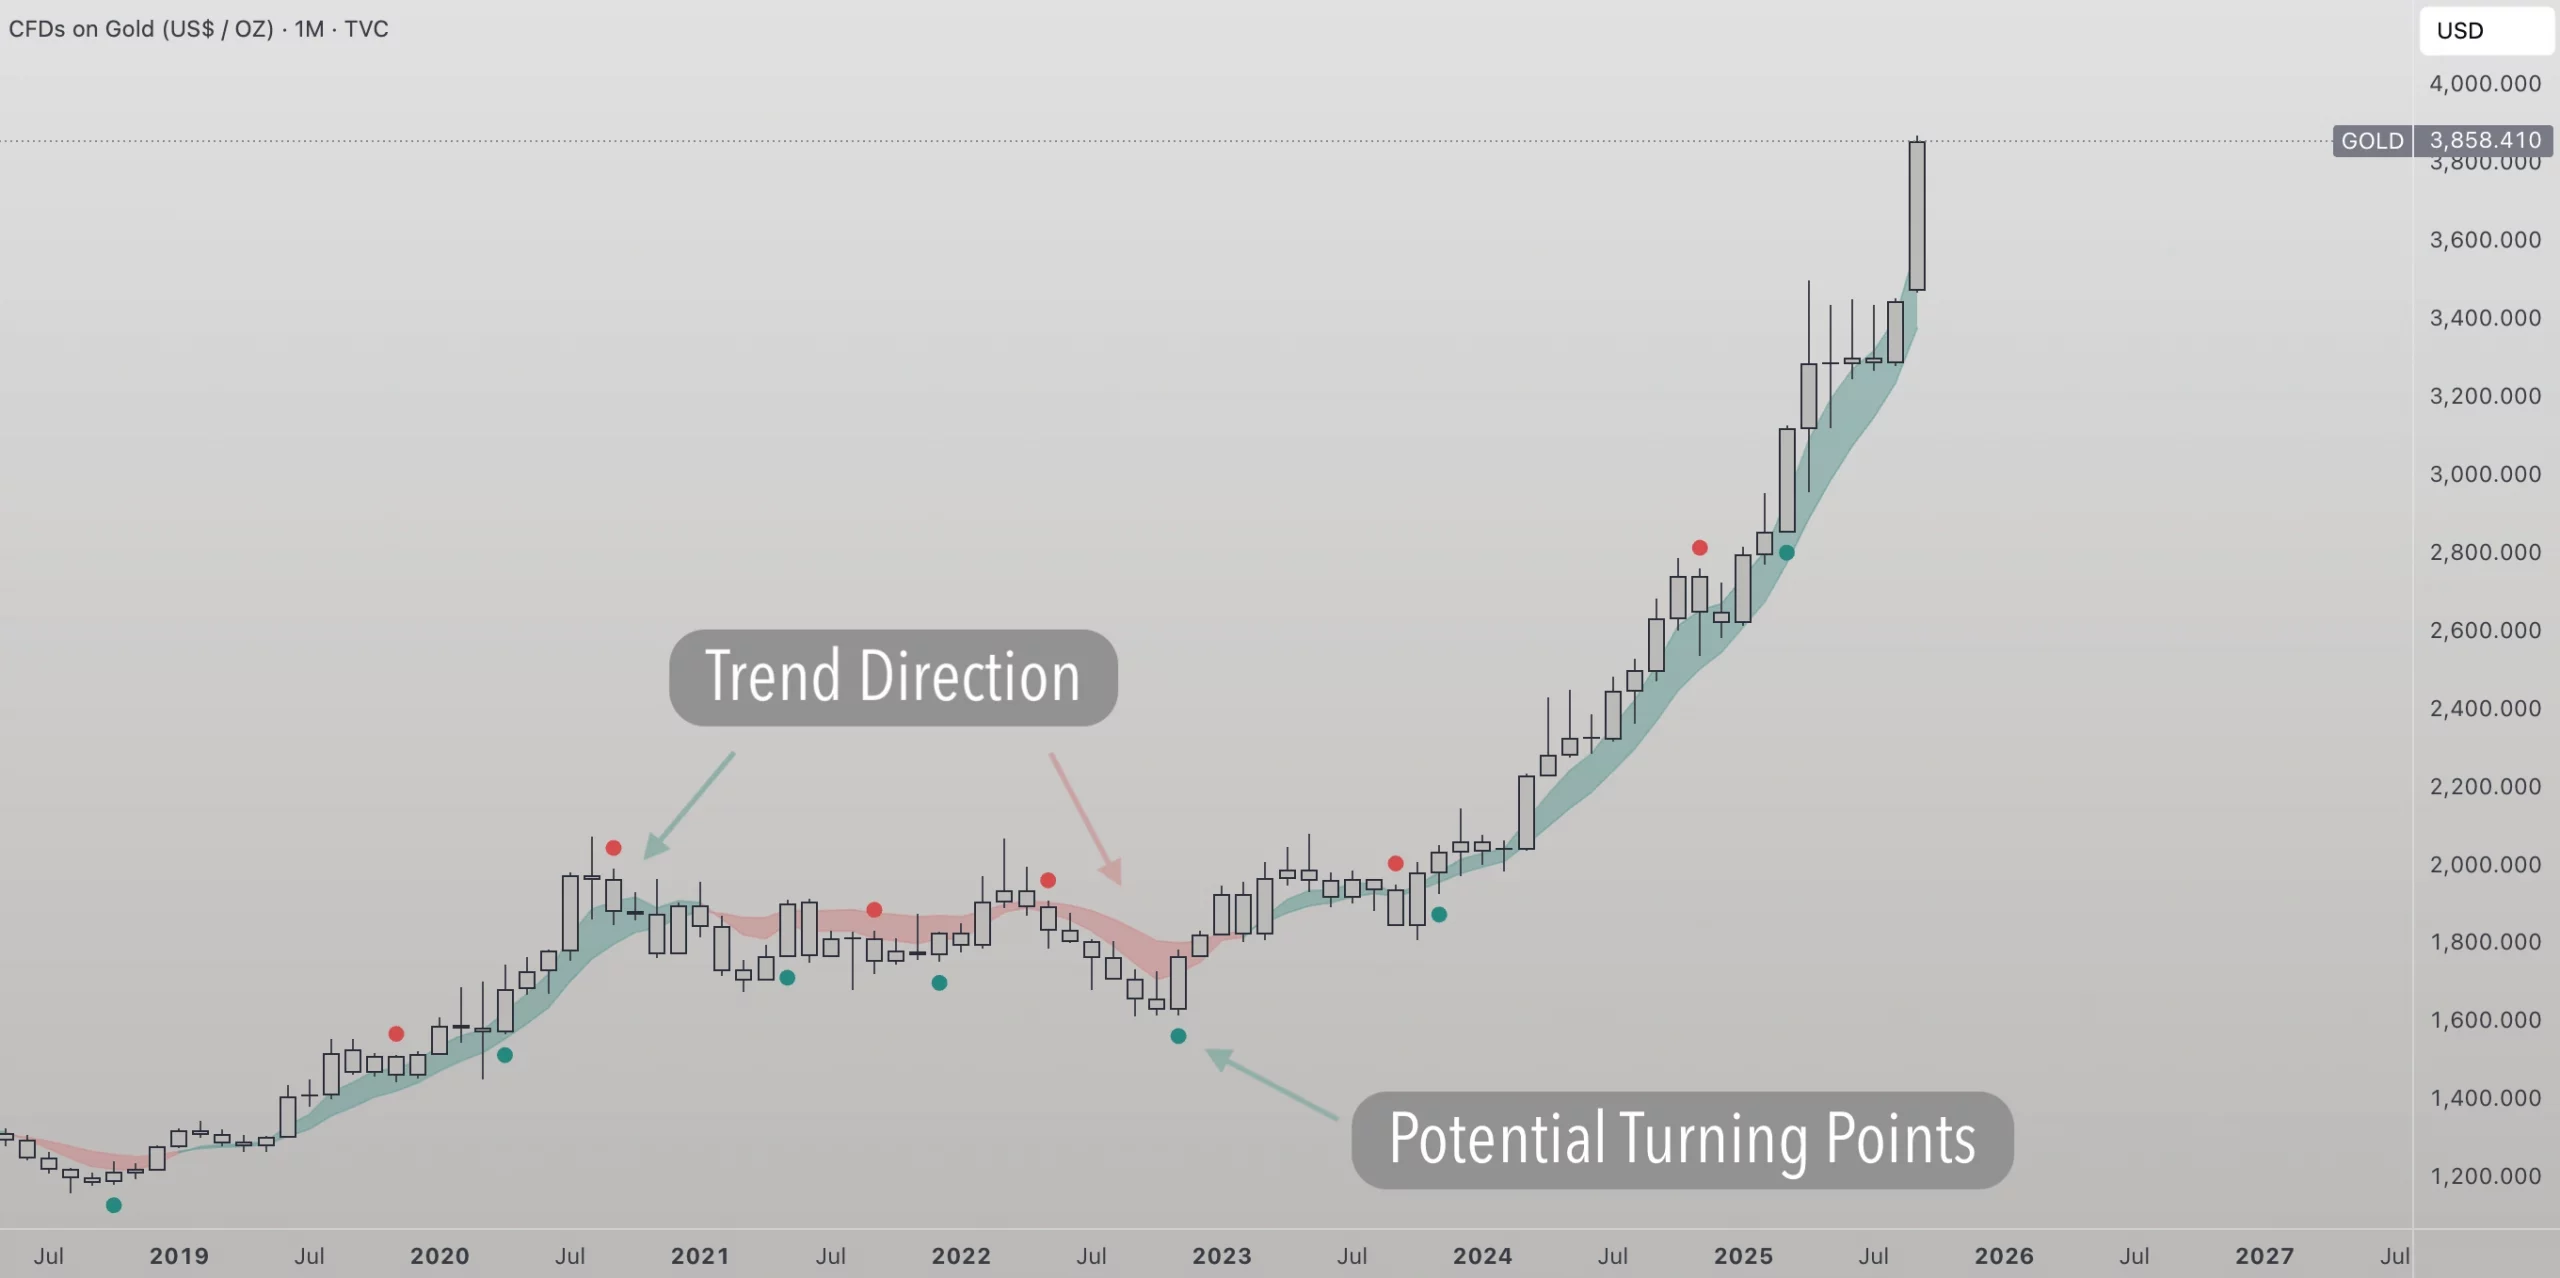
Traders AID focuses on three simple questions:
Think of it like reading a map: you see the road, the curves, and how steady the surface feels.
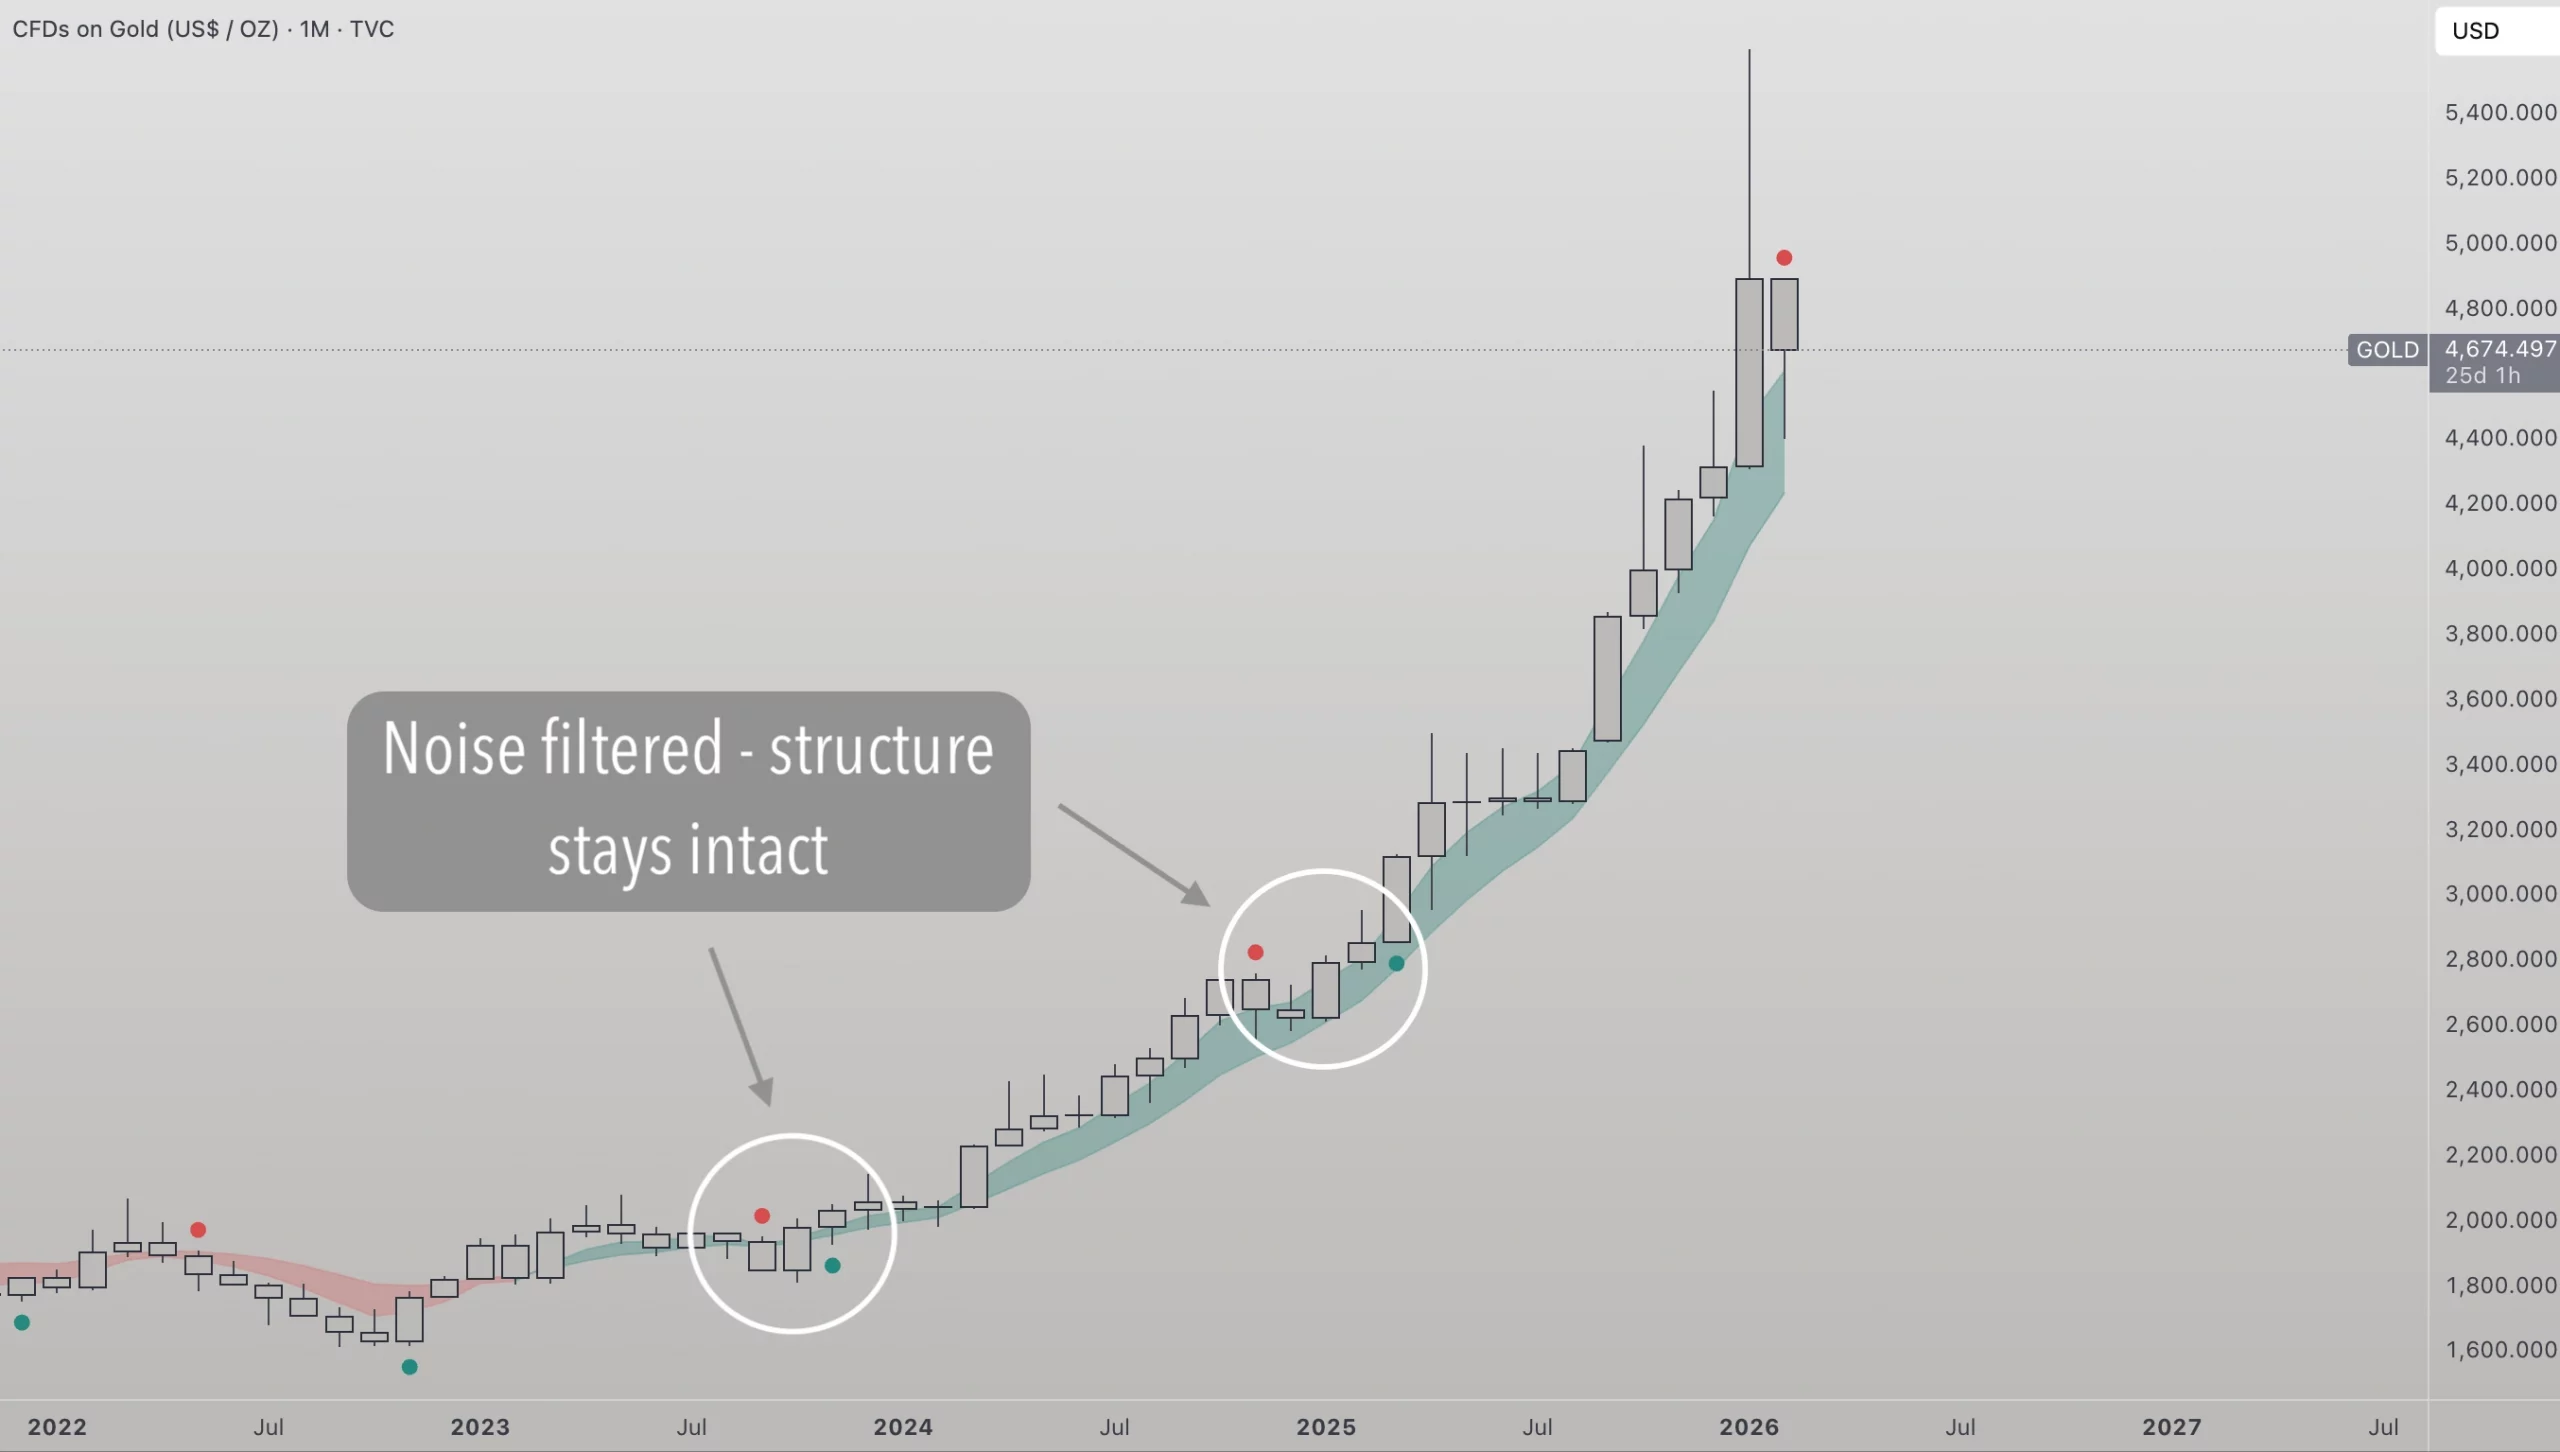
Markets are noisy. Traders AID is designed to stay calm without becoming slow.
Instead of reacting to every candle, it looks at price behavior over time by combining price, volatility, and momentum.
This helps separate meaningful movement from shortterm randomness.
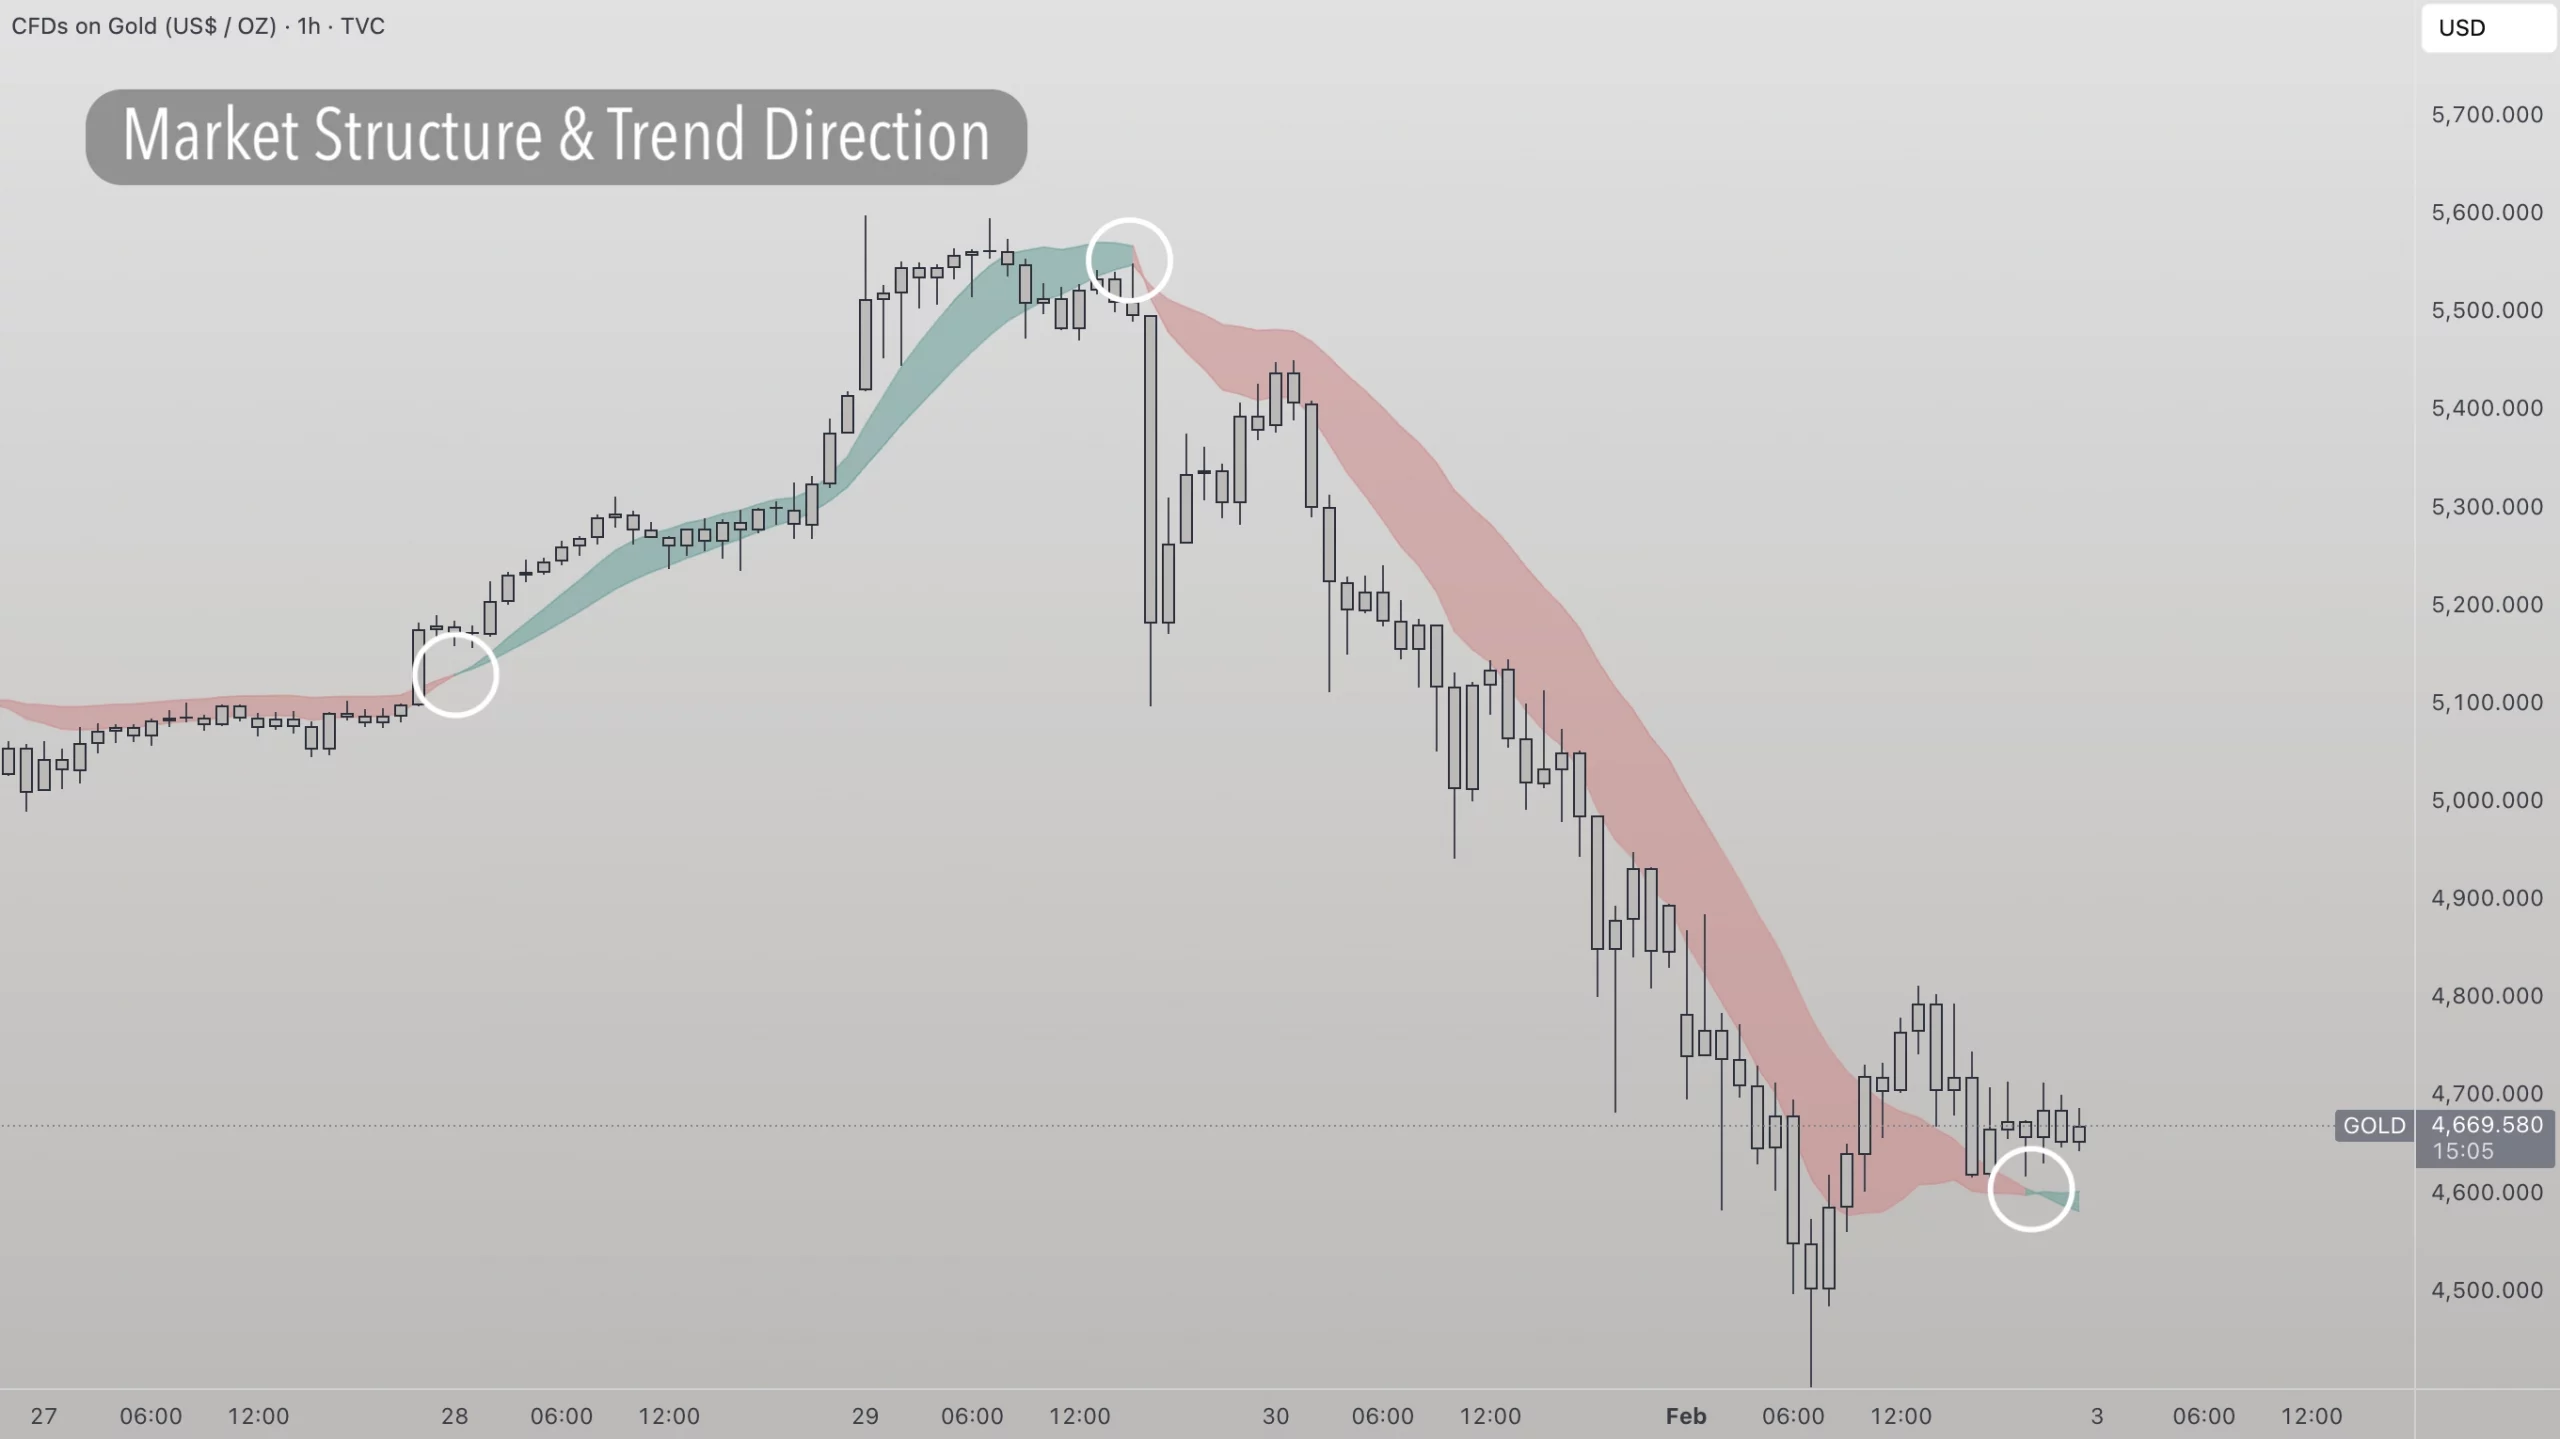
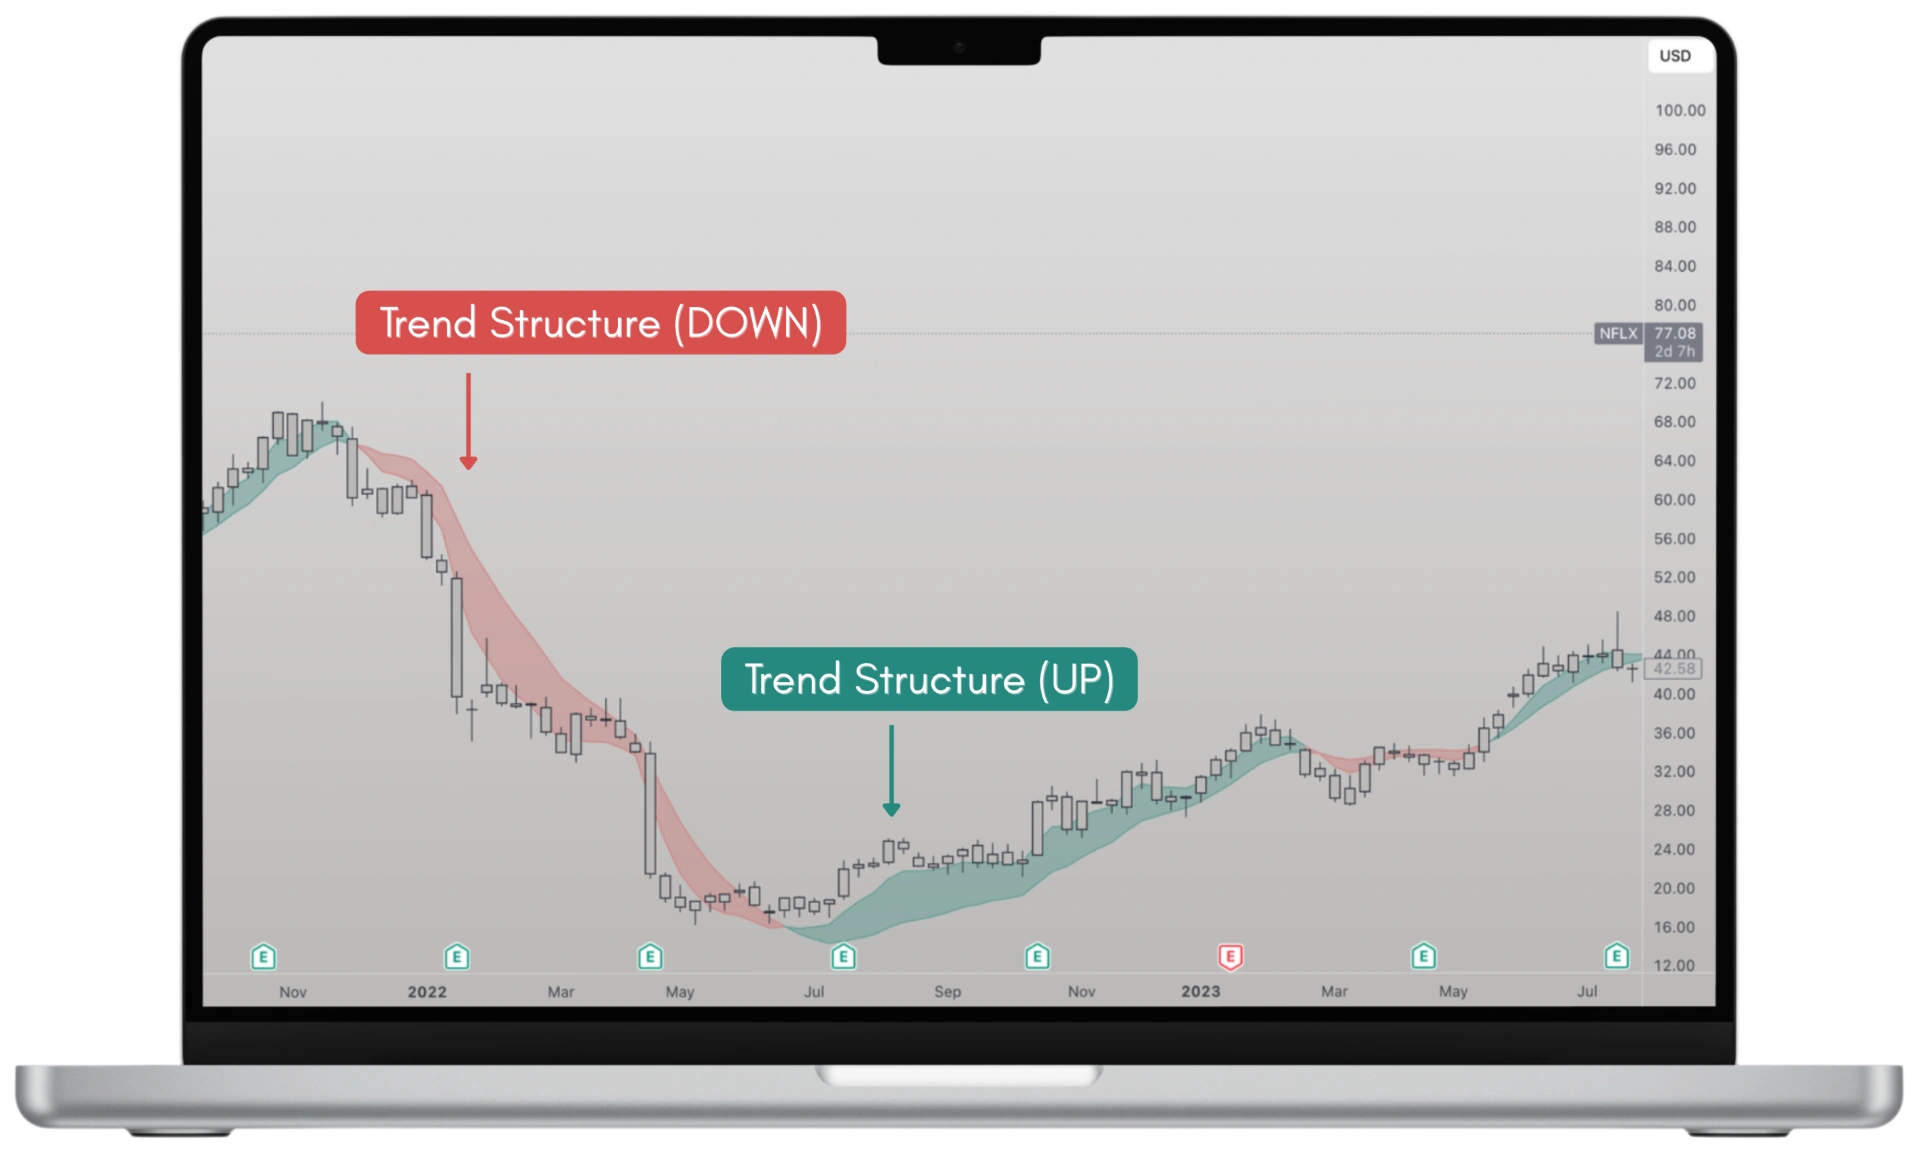
The Smoothing Channel frames the broader market structure. It is built using a Dual Kalman Filter, a method also used in GPS and navigation systems to estimate the true path while filtering out noise.
Instead of averaging old prices, the channel continuously
estimates where price should be based on how it moves. This keeps the structure smooth, while still adapting when behavior changes.
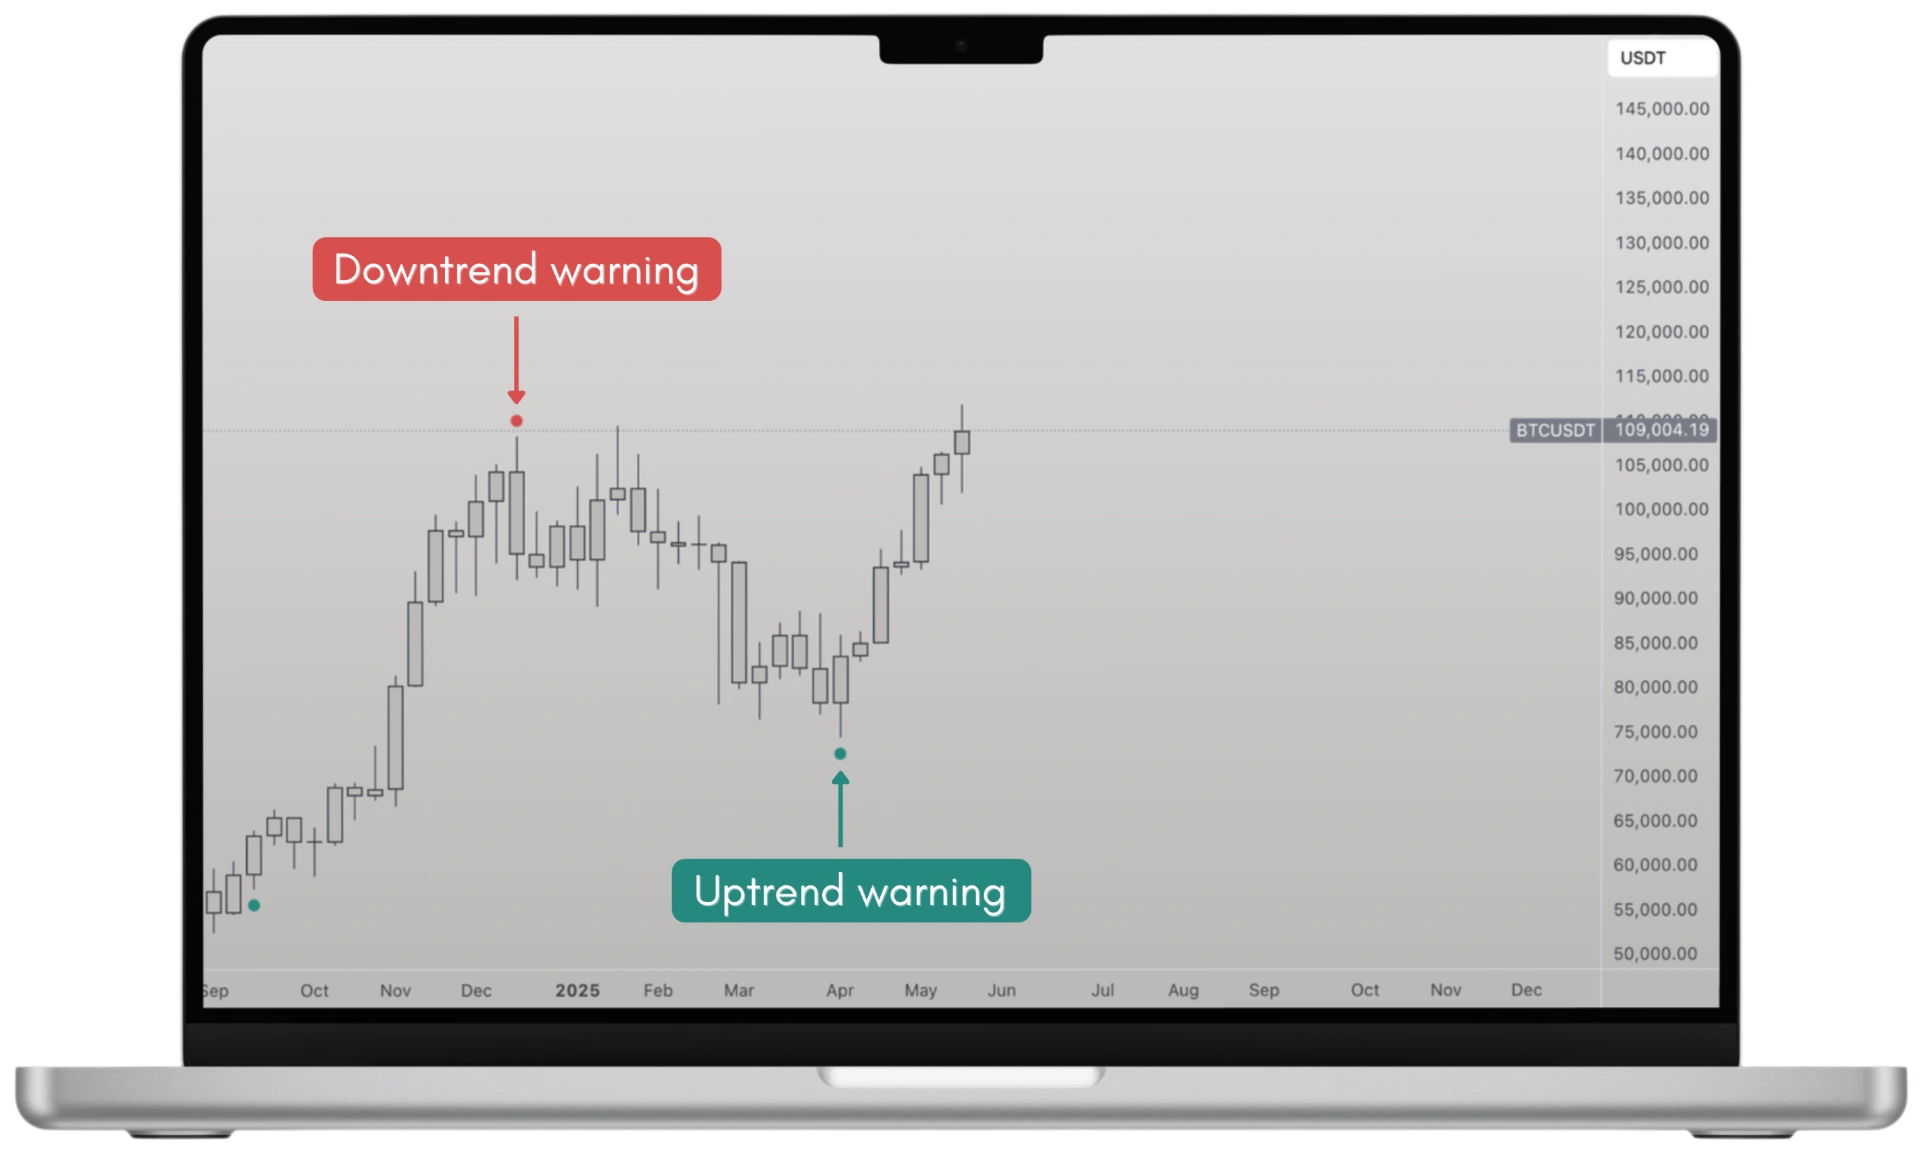
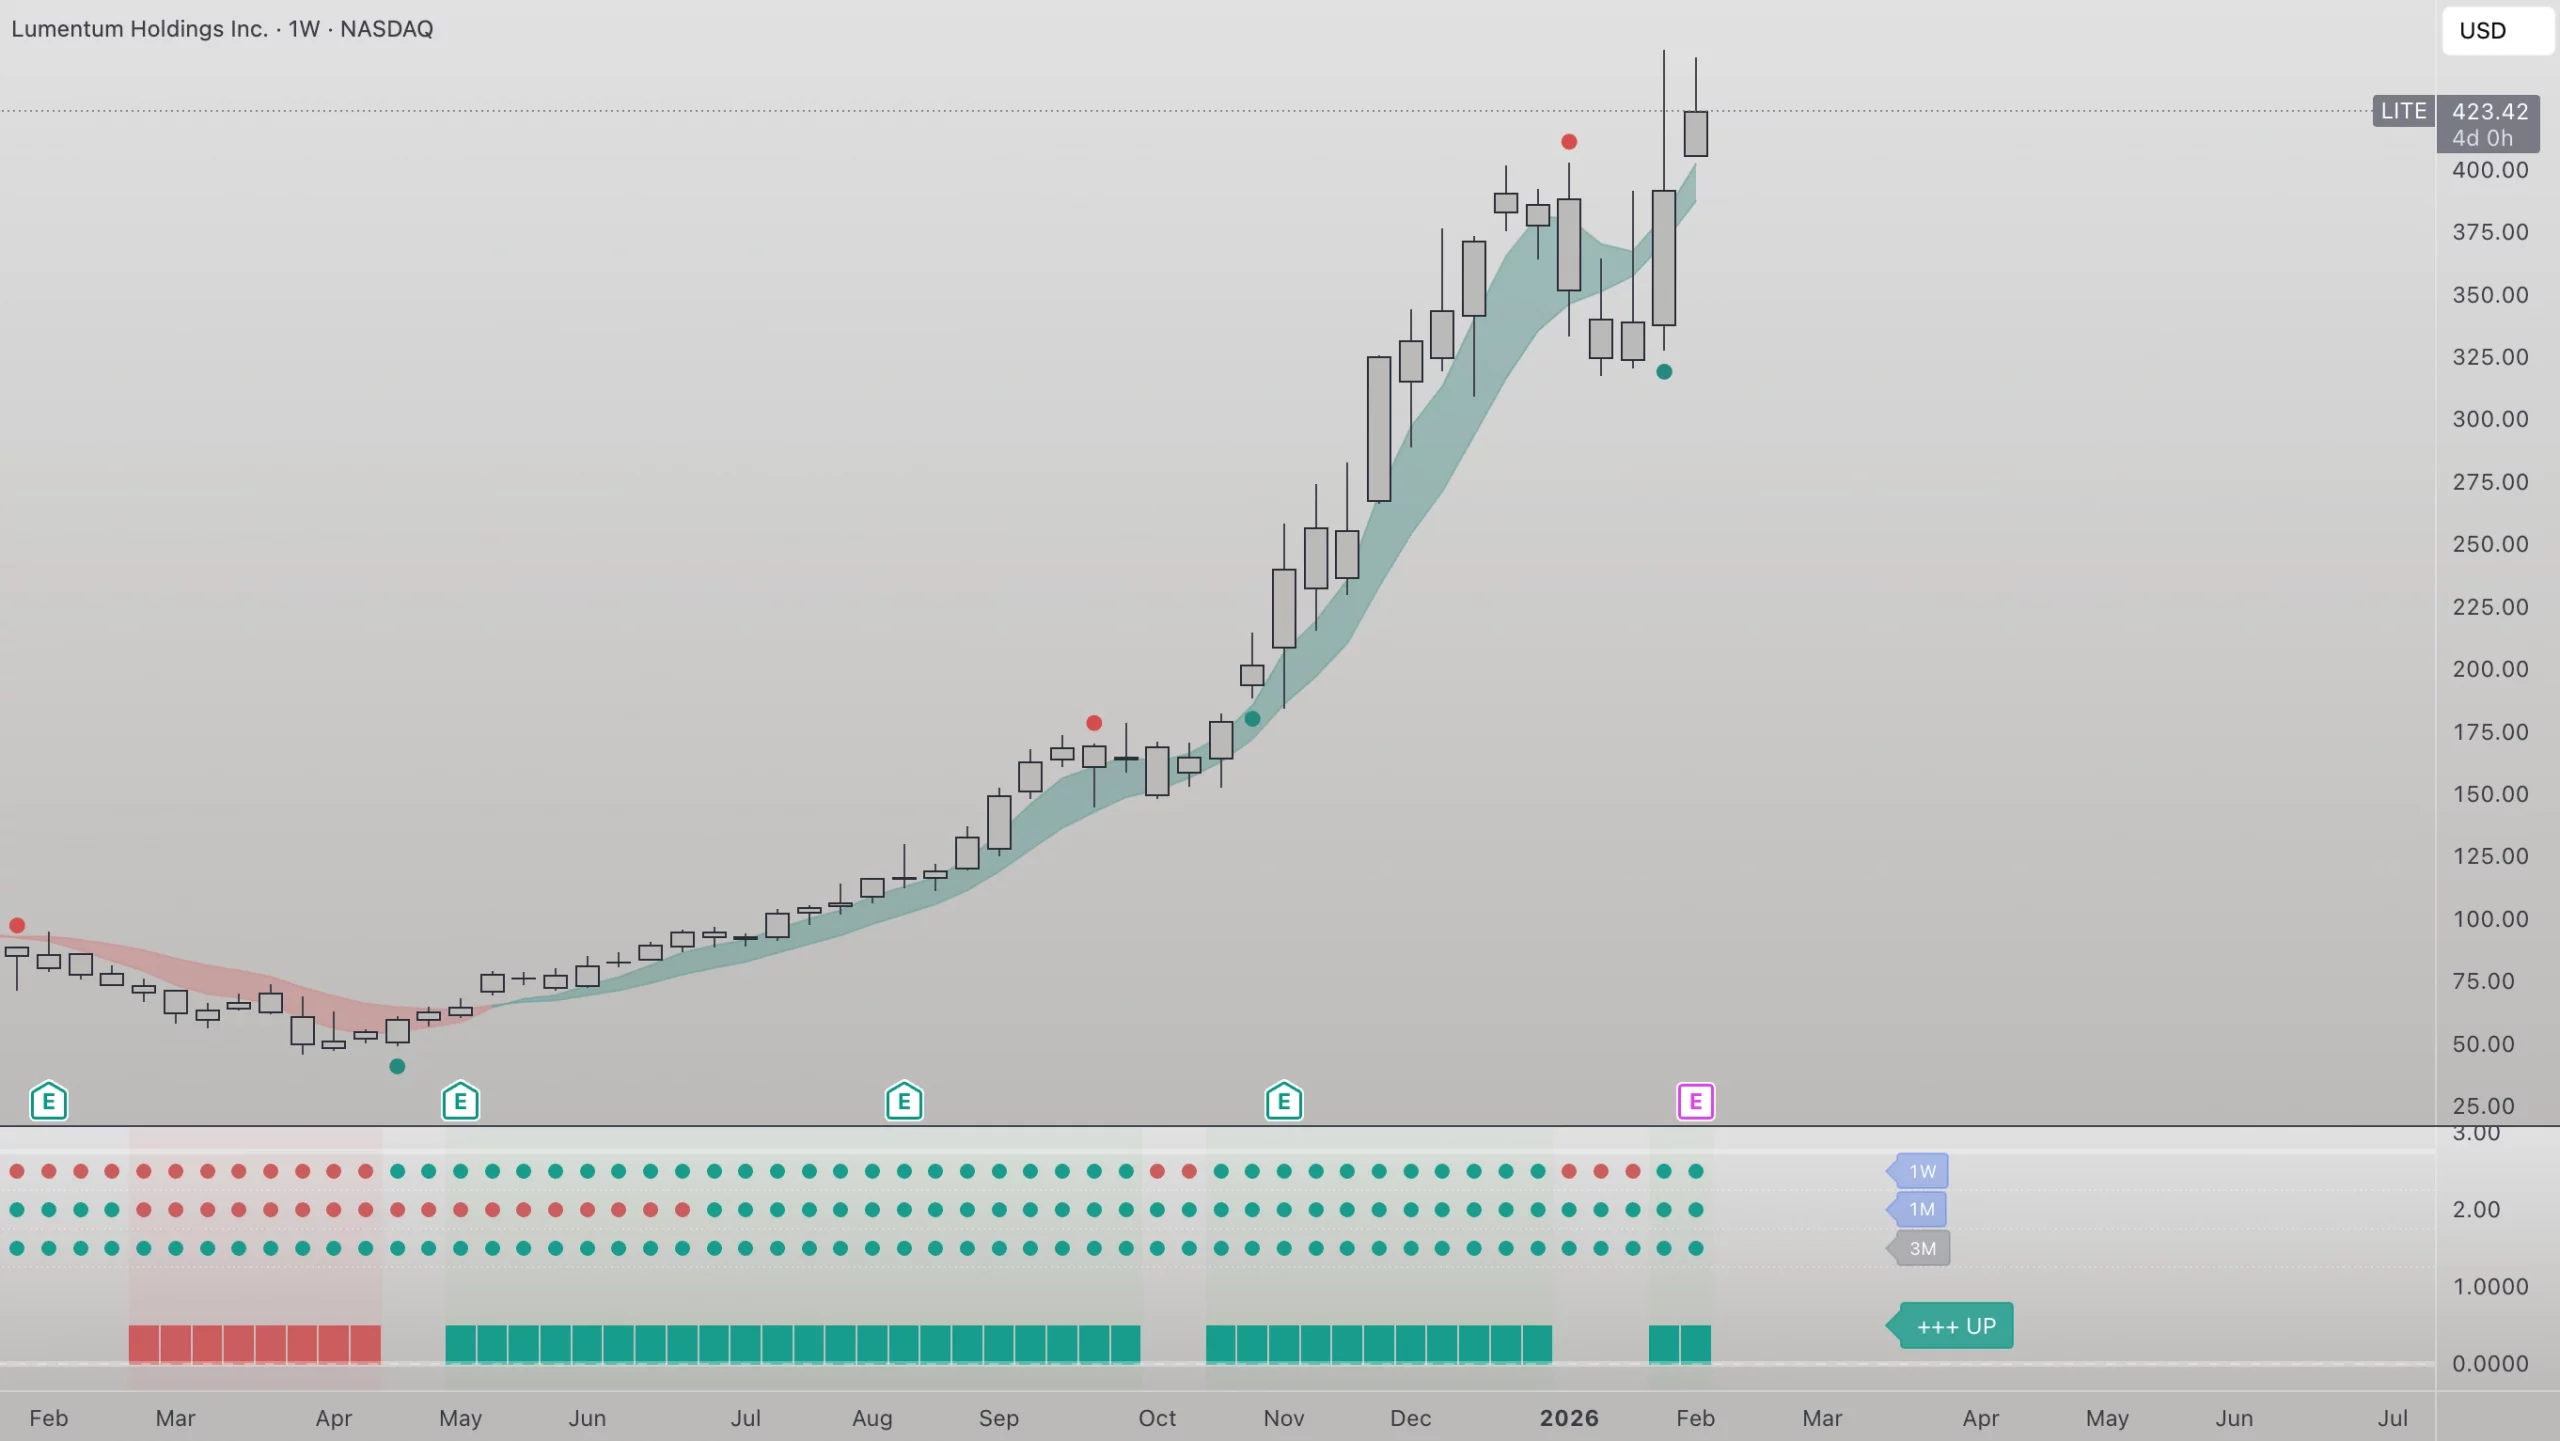
Warning Dots react faster than the channel. They combine several momentum measurements to highlight areas where market behavior may change.
An analogy: If the channel is the road, the dots are the grip of the tires — they react faster when conditions start to shift.
Depending on their position:
Dots can be used in isolation but are recommened to read in context of the channel.
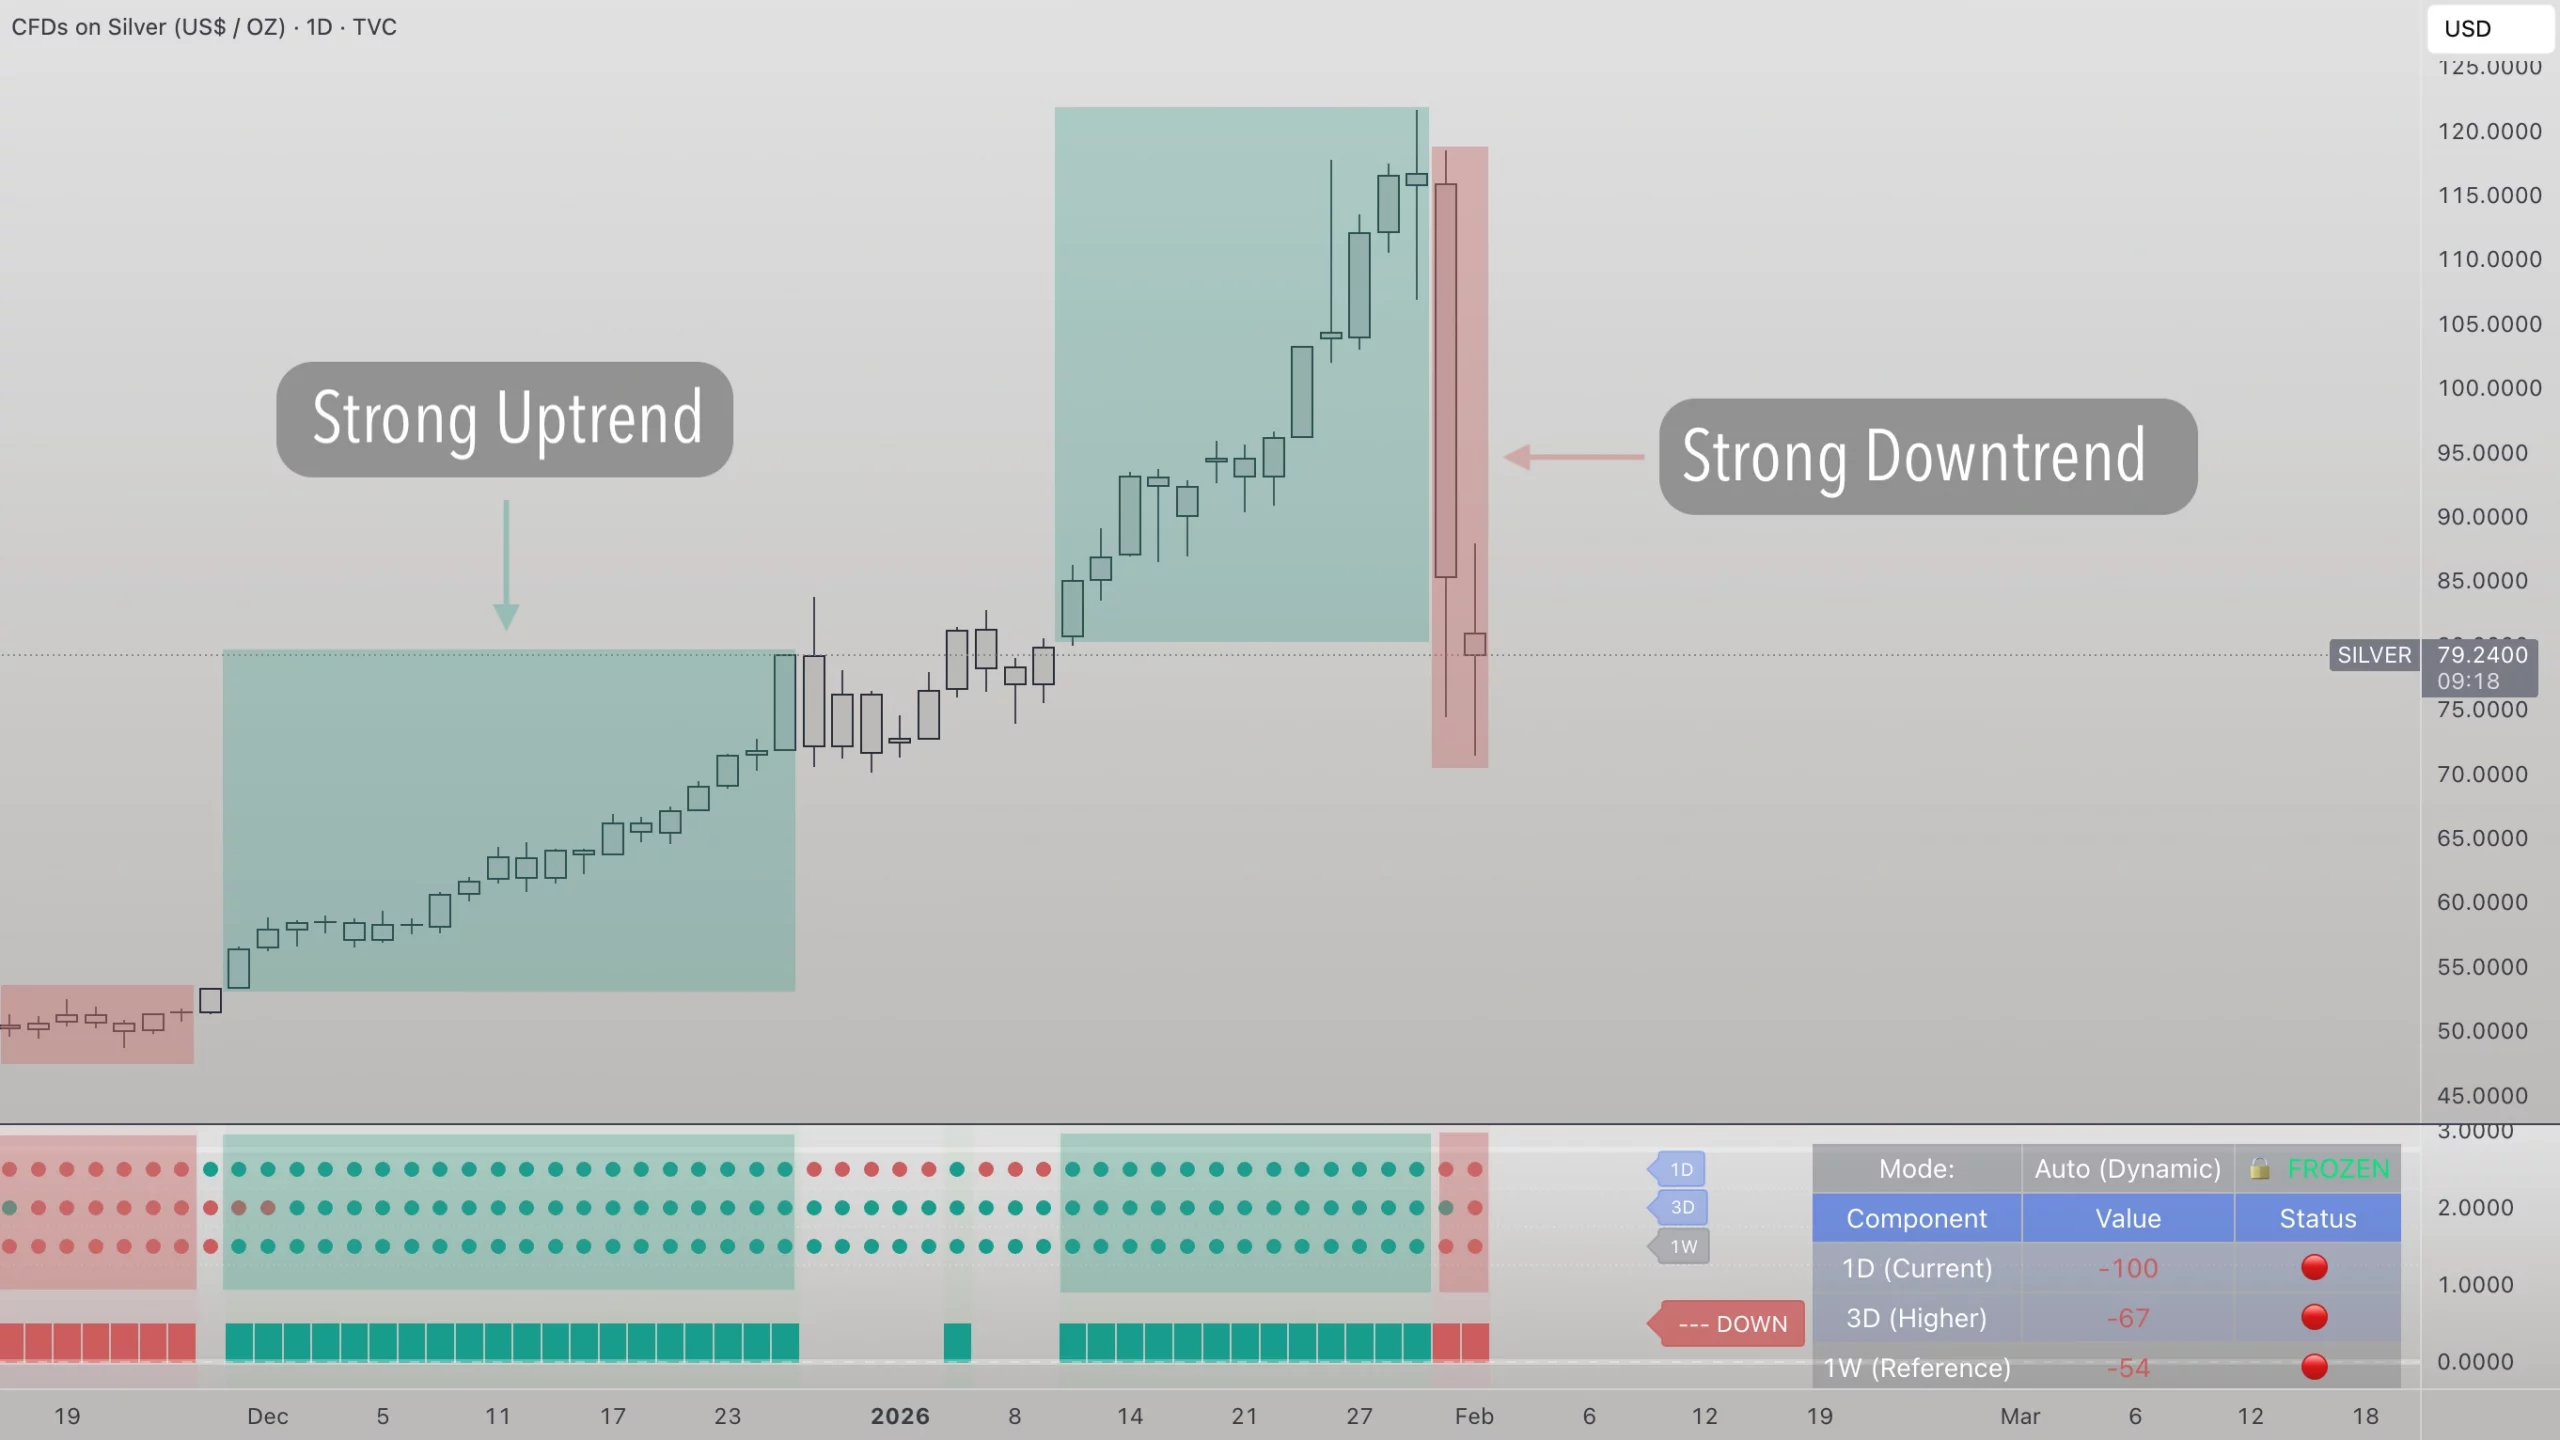
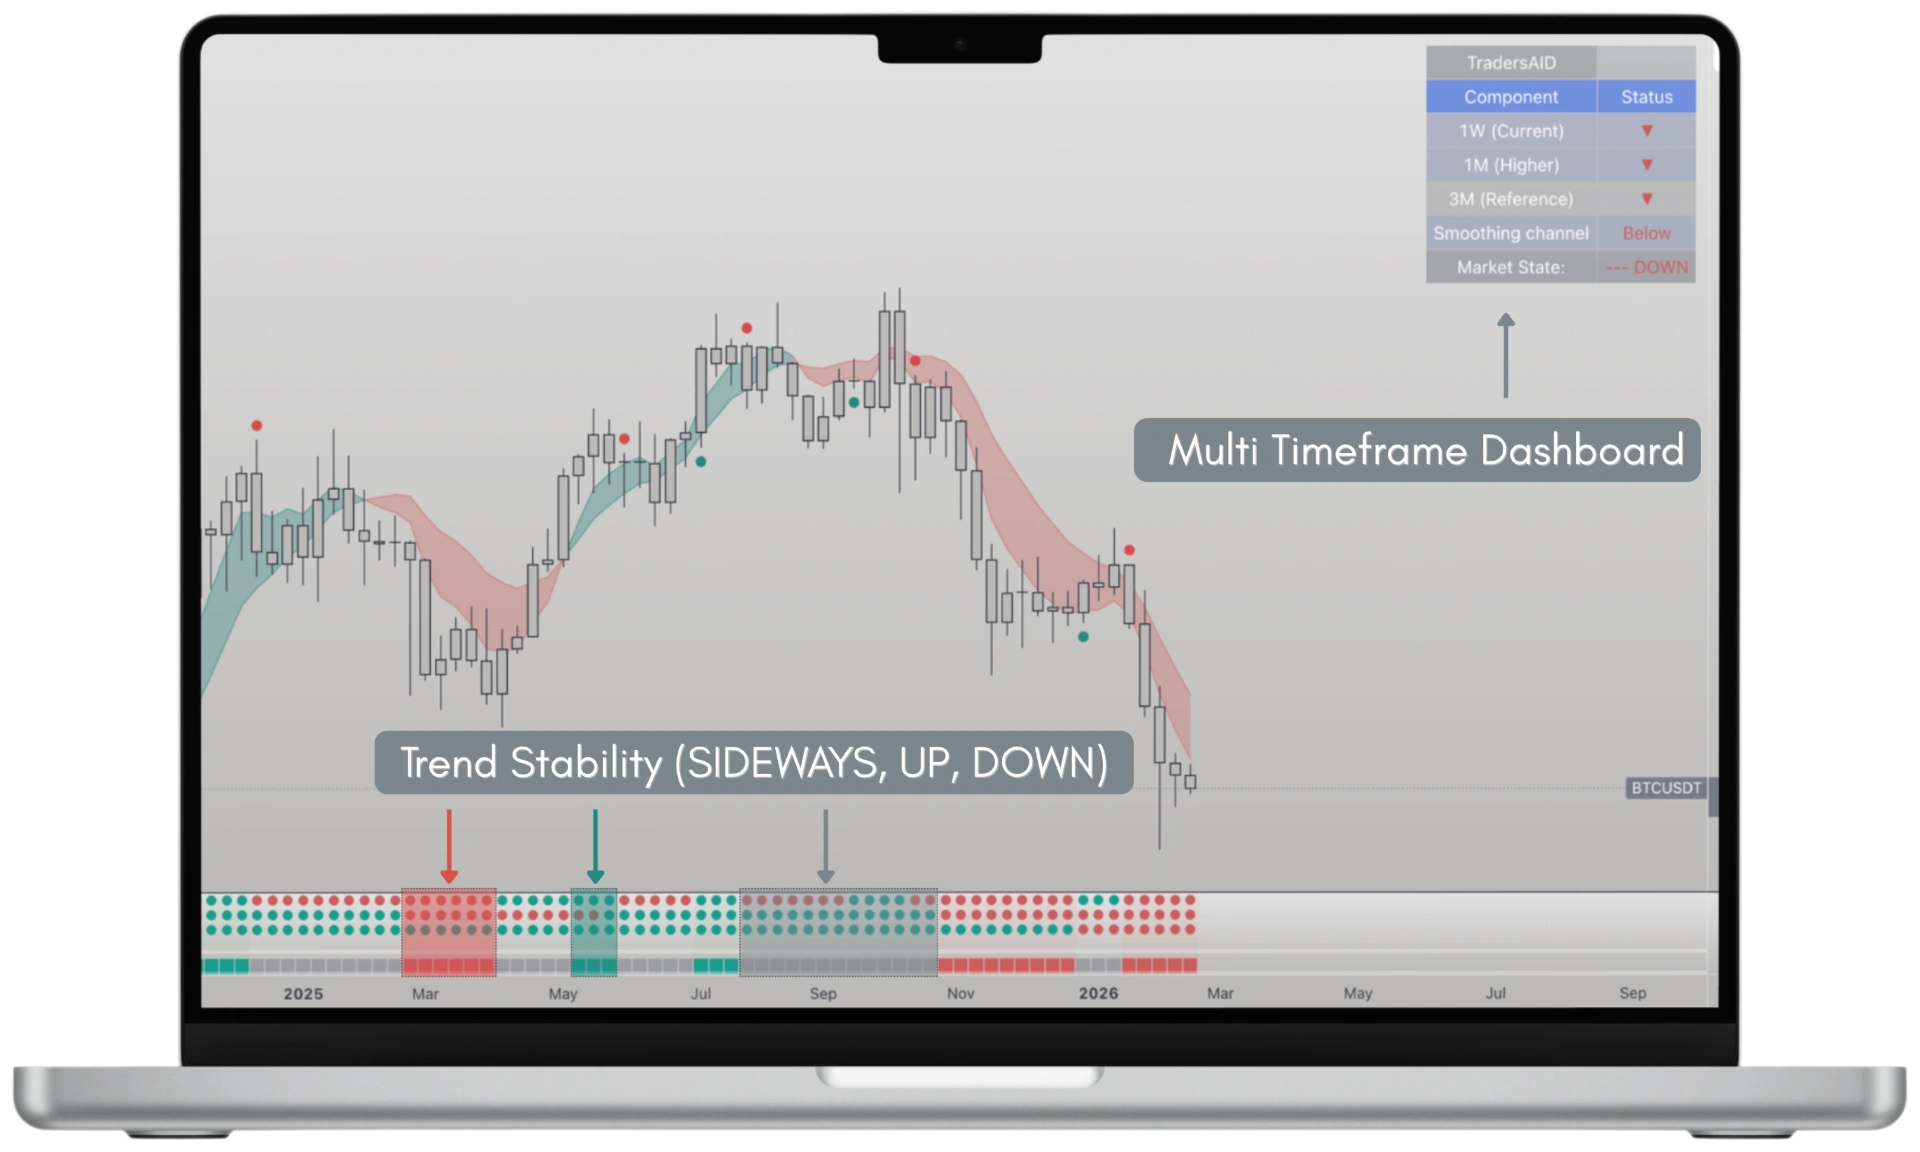
Markets move across multiple timeframes.
Trend Stability compares the direction of the current timeframe with two higher timeframes to show how stable or fragile a move appears.
When timeframes align, stability increases. When they disagree, stability decreases.
Think of it like swimming with or against a current — moving with the larger flow usually feels more stable.
(Trend Stability is in BETA and available on TradingView.)
Traders AID works best when read in a clear order:
This sequence helps combine short-term behavior with the bigger picture without confusion.
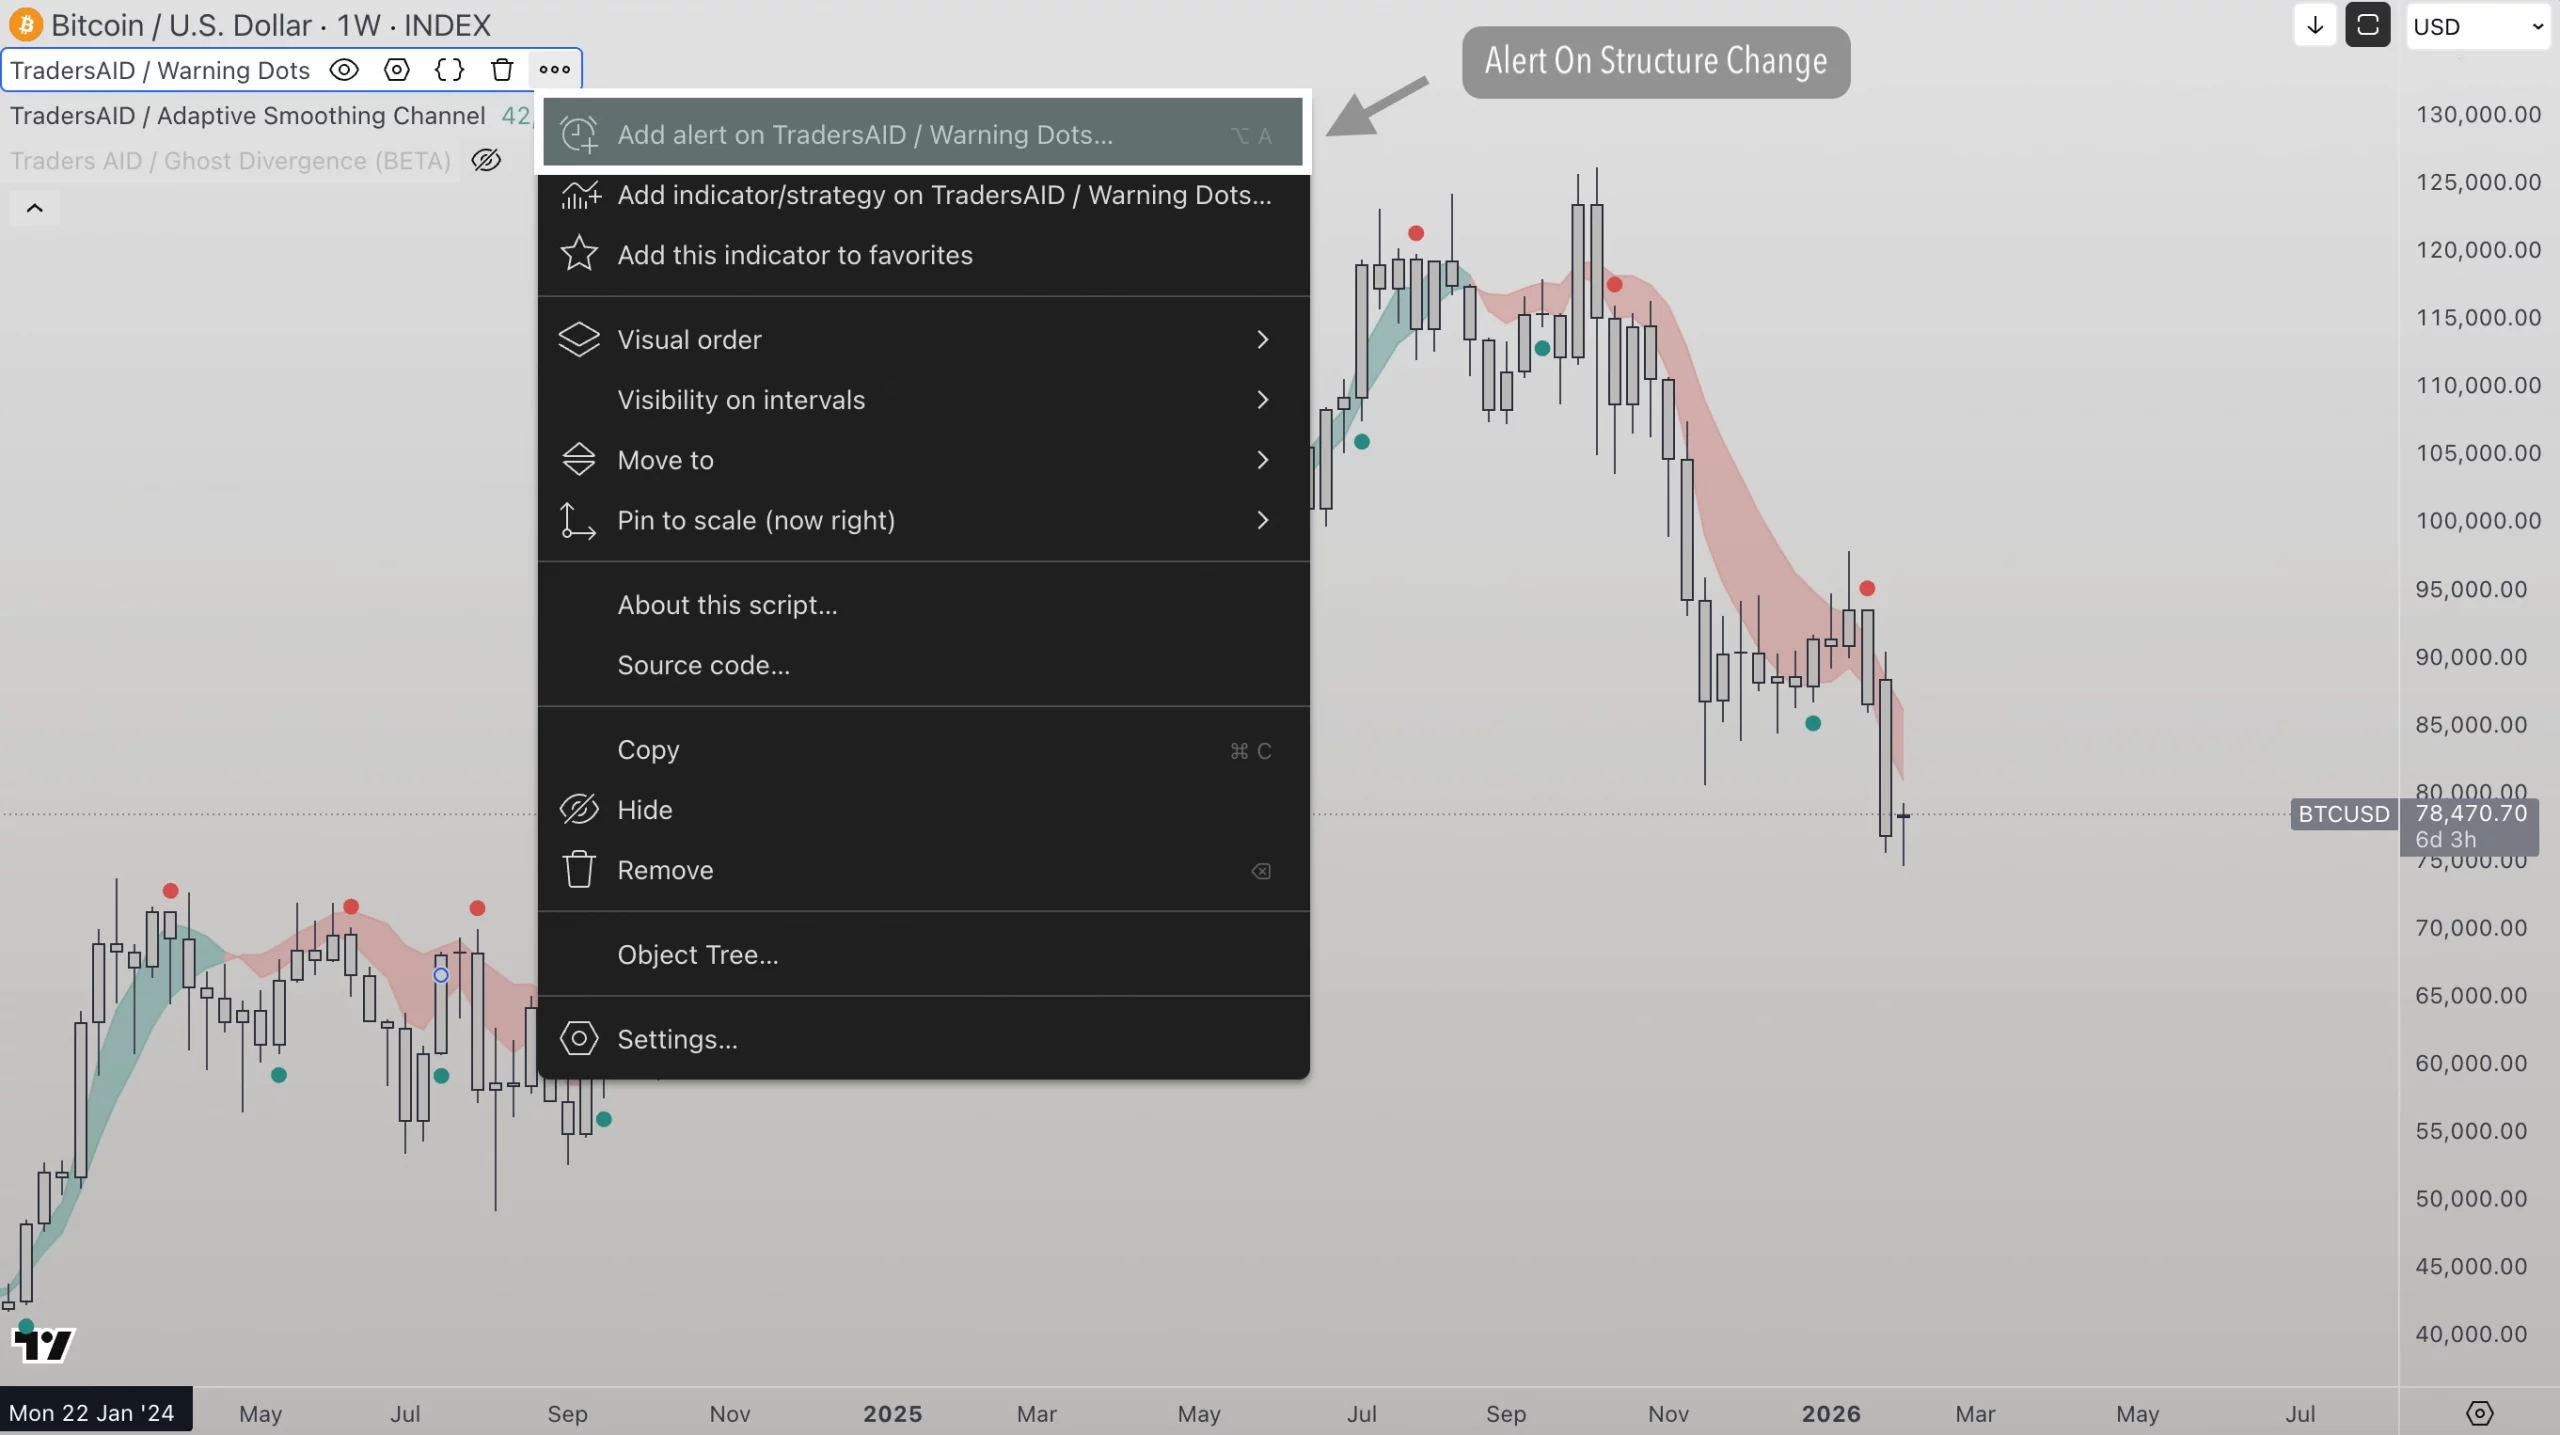
Alerts help you stay aware when conditions change.
Many users:
Alerts support awareness and efficiency, without constant screen time.
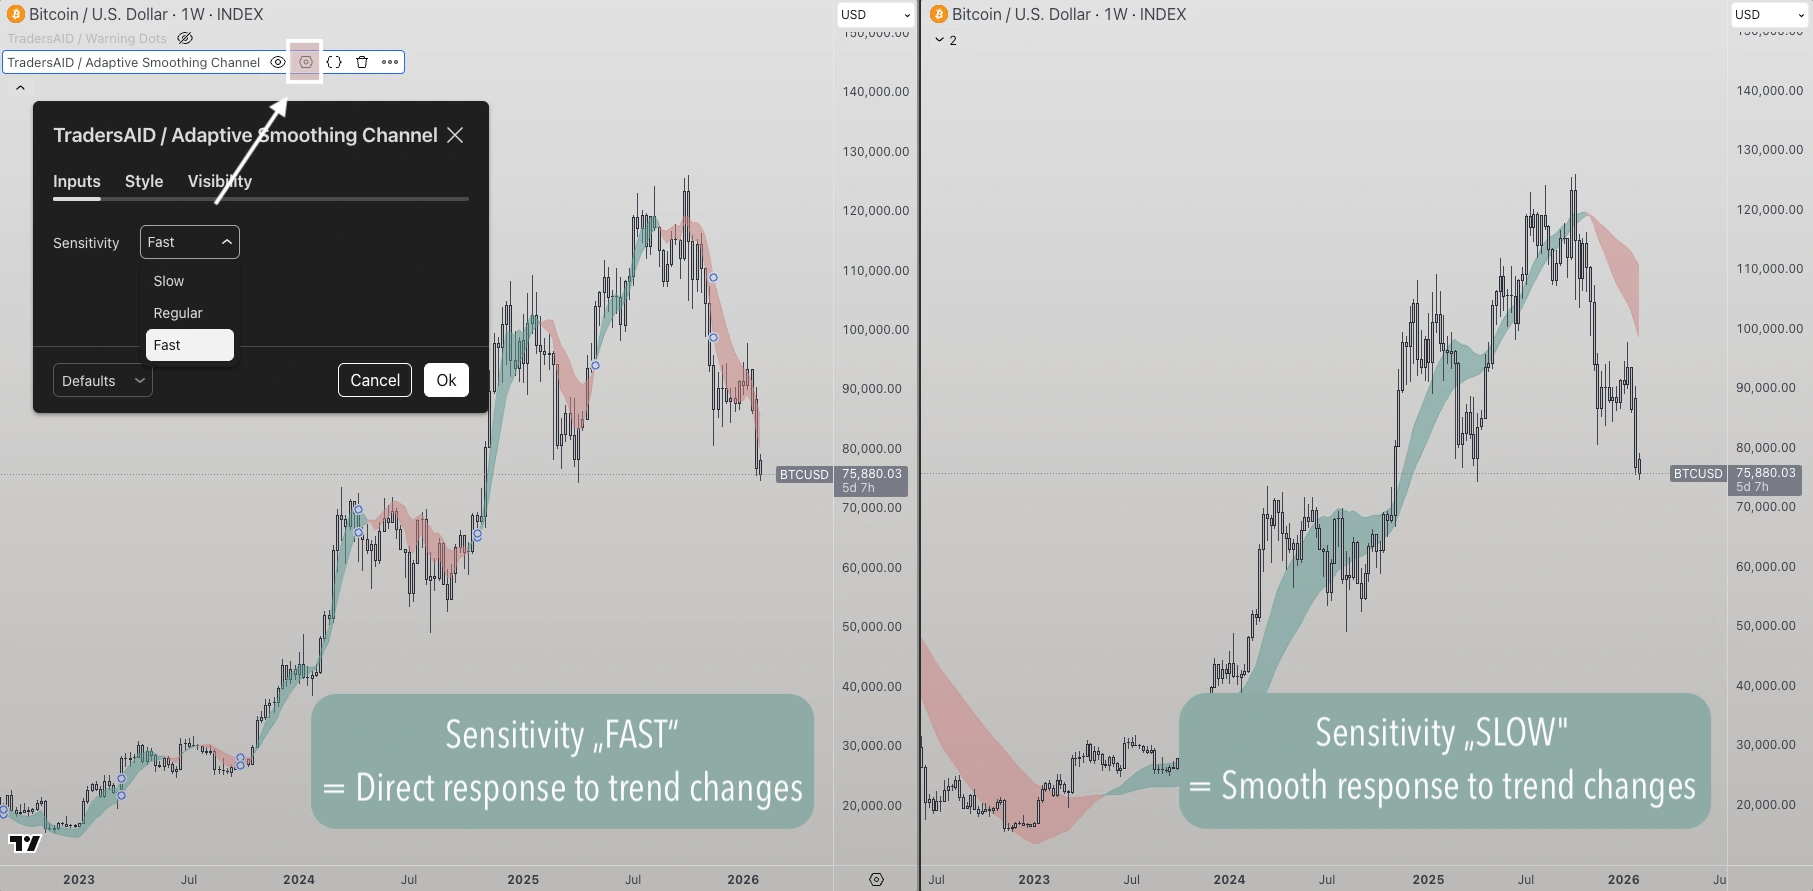
All Traders AID indicators offer three responsiveness settings:
Assets & Timeframes behave differently. Some are calm, others more volatile. There is no right or wrong setting — responsiveness is also a matter of preference.
As a rule of thumb:
The goal is to balance smooth structure with responsiveness for the asset and timeframe you’re using.
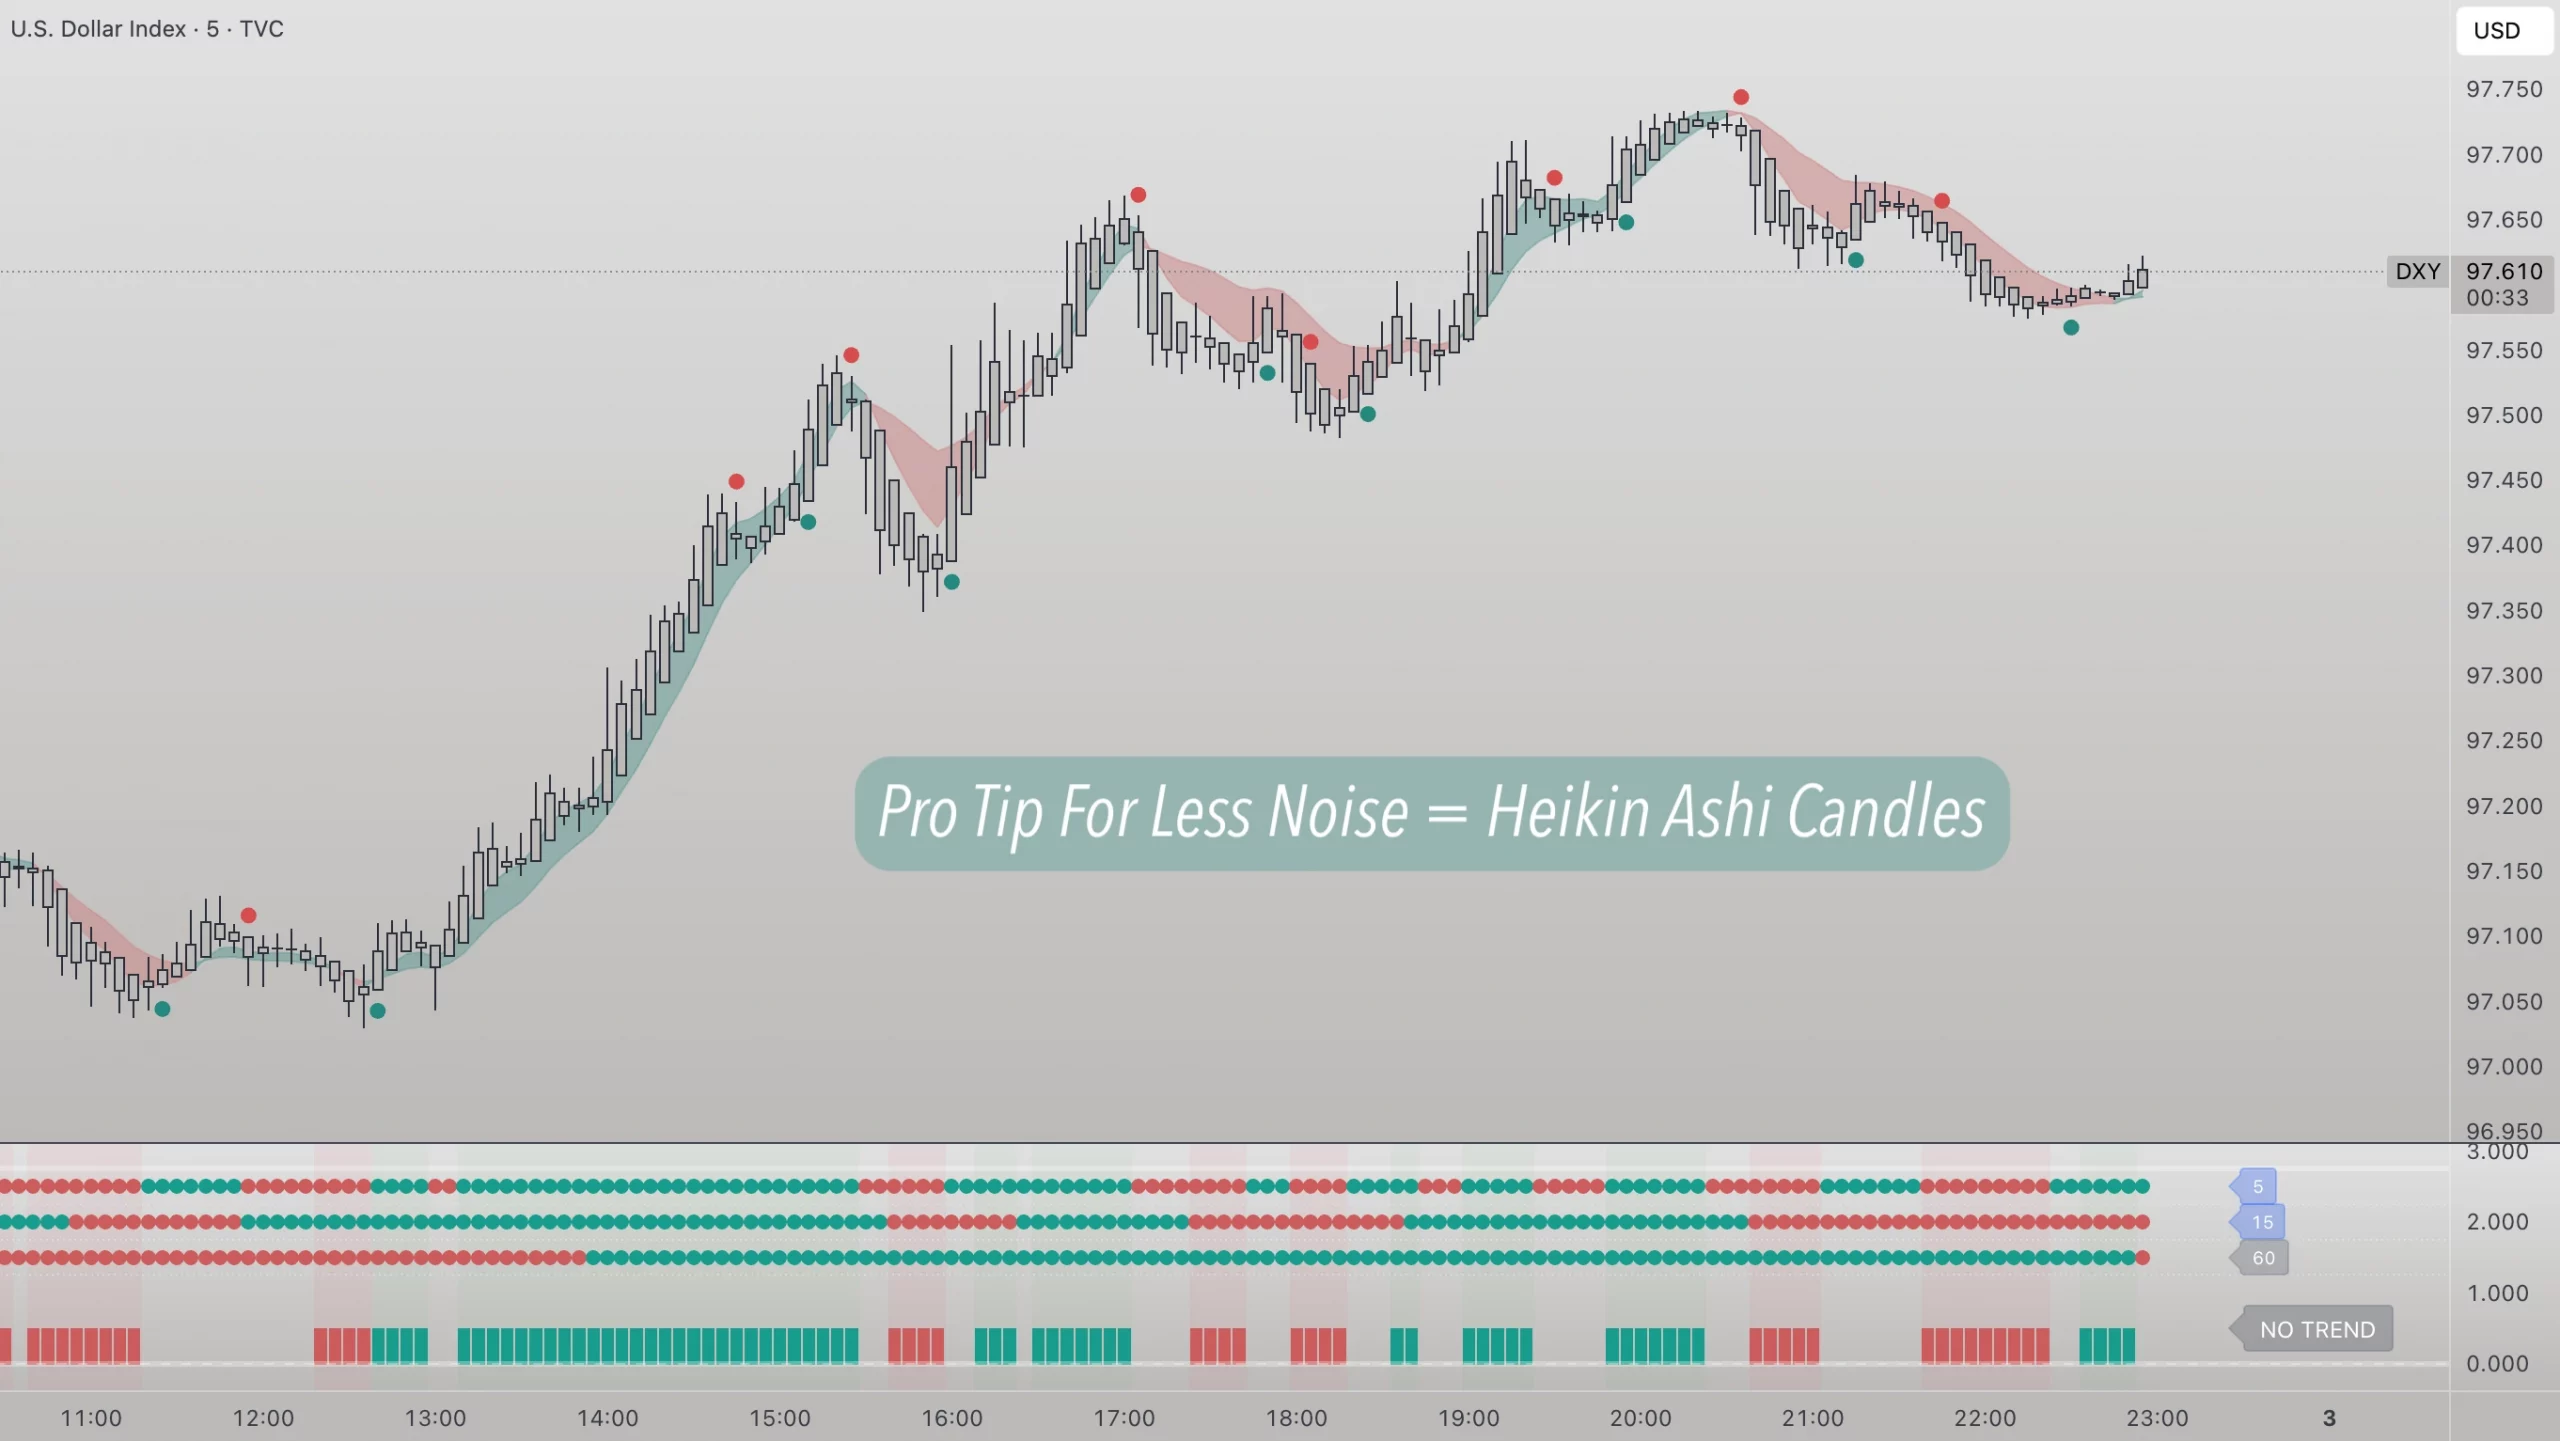
Some users switch to Heiken Ashi candles, especially on lower timeframes.
Heiken Ashi uses a different calculation method that smooths price action and reduces visual noise.
This can make structure and behavior easier to read in fast or choppy markets.
This is optional, but often helpful when working with shorter timeframes.
Traders Aid is designed to help traders, investors, portfolio managers and family offices worldwide make smart choices based on technical analysis. Here's what some of them have shared:
Our system analyzes historical data to uncover market strength and identify potential trend shifts, providing insights to help you stay ahead.
Track trends effortlessly, make smarter decisions, and optimize your portfolio with the power of a momentum indicator built for you.
Discover potential turning points—up or down. Read market structure clearly and focus on where trend behavior may be changing.
Our tool turns raw data into clear insights using advanced technical analysis. Whether you need quick updates or deep analysis, we deliver what you need, how you need it.
External data feeds providing instant market data to our server.
Technical analysis of market data with proprietary logic of Traders Aid
Web-application with personal dashboard and asset crawler.
Integration of warning symbols & scoring in existing platforms.
API to provide customized data to external applications.
Here, you will find answers to the most commonly asked questions about our Technical Analysis Tool. Whether you are a new user or an experienced trader, this section is designed to provide you with the information you need to make the most of our platform.
Traders AID uses proprietary algorithms and technical analysis to accurately identify trends and potential trend changes for various assets, such as stocks cryptocurrencies and commodities. It takes into account multiple factors, including price movements, momentum, and various formulas to provide reliable trend shifts.
Yes, Traders AID can be used for both short-term trading and long-term investing. It provides insights for trend changes that can support decision-making in various timeframes.
Yes, Traders AID can be used as a standalone trading indicator. It provides comprehensive trend identification, making it a powerful tool for traders who prefer to use it on its own or as a key component of their trading strategies.
Traders AID is not promising 100% accuracy or win rate. Trading and investing is a complex symbiosis of analysis, decision making and execution. Traders AID is here to help you analyze the market in the right way and to becoming aware of trend changes very early.

Our momentum indicator uses red and green dots to highlight potential trend shifts, giving you clear insights to make timely decisions.